Introduction
The lack of available and affordable child care prevents many Oregonians from participating in the workforce as much as they would like and reduces overall economic prosperity. Child care takes up a growing share of household budgets in the United States, far above what is considered affordable. This lack of affordability is not isolated to low-income households, with families across the income spectrum facing high costs. For most households with two or more children under the age of five, child care costs are larger than those for mortgages or rent.
The U.S. Department of Health and Human Services defines affordable child care as costing no more than 7% of household income. In reality, the national average is well above this mark—and in Oregon, infant care costs run between 13.3% of income in Crook County and 22.8% in Josephine County. In dollar terms, this translates to about $948 to $1,255 per month per child, with costs climbing as high as $1,956 in Multnomah County. Oregon ranks as the 12th most expensive state in the country for infant care, with average annual costs exceeding $14,000.[i]
High costs are only half of the story. Access is equally challenging. According to the most recent annual report from Oregon State University, 34 of Oregon’s 36 counties are considered “child care deserts.” A child care desert is a census tract with more than 50 children under the age of five where there are more than three times as many children as available licensed child care spots. For many families, this means waitlists, limited options, and added stress on top of already steep expenses.
The combination of limited access and high costs carries serious consequences. Parents may be forced to step back from work until their children are older, losing wages and potentially stalling their career potential. Some younger adults are even delaying or forgoing having children altogether, contributing to declining fertility rates and long-term demographic change. The fertility rate in Oregon ranks in the bottom five across states. Employers also feel the strain, as difficulty finding reliable child care drives employee turnover, raises labor costs and disrupts workforce stability. In addition, higher child care costs put downward pressure on net migration, leading to slower population growth.
Solving Oregon’s child care challenges will require collaboration across sectors. Barriers to increasing child care capacity include difficulty in finding suitable physical space, a ready workforce, and forming a sustainable business model. Since affordability and availability vary widely across communities, local solutions tailored to each area’s needs will be key to building a system that works for families, businesses, and the state’s future economy.
Key Findings
- The lack of available and affordable child care prevents many Oregonians from participating in the workforce as much as they would like and reduces overall economic prosperity. Oregon ranks as the 12th most expensive state in the country for infant care, with the average annual cost exceeding $14,000.
- Among Oregon’s 10 most populous counties, center-based infant care ranges from a low of $1,018 in Douglas County to a high of $1,956 in Multnomah County. These costs represent, on average, 17.4% of the typical wages, far exceeding the U.S. Department of Health and Human Services definition of affordable child care,7% of household income.
- Although Oregon’s child care is more expensive, the state is not alone. The U.S. Department of Labor reports American families typically spending between 8.9% and 16.0% of their median income on full-day care for just one child.
- When looking at Multnomah, Washington, Clackamas, Lane, Marion, and Jackson counties, the number of hours needed to work at the average wages to afford child care ranges from a low of 7.7 hours each week (Marion) to a high of 12.1 (Multnomah).
- The cost associated with child care is only one side of the coin of child care. Availability is also an issue:
- 23% of children aged 0-2 statewide have a regulated spot available.
- 42% of children aged 3-5 statewide have a regulated spot available.
- Slot availability varies widely across the state:
- Gilliam (57%), Wasco (48%), and Multnomah (45%) counties exceed the statewide average in slots per child.
- Linn (18%), Tillamook (20%), and Harney (21%) have fewer slots per child.
- Child care capacity is limited in Oregon due to three primary factors: a lack of qualified physical space, a shortage of ready workforce, and challenges in building a sustainable business model without public subsidies.
- Encouragingly, the lack of child care supply has lessened significantly in recent years across most regions of the state. Low birth rates have played a role, but most of the progress has been due to capacity increases fueled by public policy.
- Child Care Affordability Index: For center-based infant care (ages 0-2), no Oregon county meets the federal affordability benchmark of 7% of household income. Even in the least expensive counties, infant care consumes 10-12% of income. While high-cost counties like Multnomah and Josephine it exceeds 20%.
- Regulatory burdens and public funding matter: Interviewees consistently mentioned high regulatory costs as a barrier to expanded slots. Additionally, without publicly funded slots for infants/toddlers, all 36 counties would be deserts, and 78% would be deserts for preschool.
- Expanding availability and lowering the cost of child care would have an economic impact:
- Add nearly 26,00 new jobs by 2030.
- Expand the labor force participation by 31,000 entrants, mostly female.
- Increase Oregon’s GDP by about $6 billion.
- Boost total business sales (output) by $10 billion.
- Lift disposable personal income by $1.2 billion.
- Generate roughly $104 million in additional state revenues during the 2025-27 budget cycle. This is important given the tight nature of the state budget.
Child Care Costs Outpace Affordability Standards
In Oregon, the cost of infant care is steep, no matter where families live. Monthly prices for center-based infant care range from about $950 in rural counties to nearly $1,956 in Multnomah County, with a statewide average of $1,168 per month.
Figure 1
For Oregon’s ten most populous counties, these costs amount to an average of 17.4% of the typical wage. Even in Crook County—the lowest among large counties—infant care still takes up 11.7% of income, far above the U.S. Department of Health and Human Services’ standard of affordability, which defines child care as affordable only if it consumes 7% or less of family income.
Oregon’s experience mirrors national patterns. The U.S. Department of Labor reports that American families spend between 8.9% and 16.0% of their median income on full-day care for just one child, with annual costs ranging from $6,552 to $15,600 in 2022. In both Oregon and the U.S. overall, the gap between what families pay and what is considered affordable is wide.
Figure 2
Costs also vary by both geography and care setting. In larger counties, center-based infant and toddler care is consistently the most expensive—approaching $19,200 per year in counties with more than 100,000 residents. By contrast, families using home-based providers pay less—around $11,500 for infants in large counties—but these options are limited in supply. Costs fall as children age: preschool care is less expensive, and school-age programs are the least costly, especially in home-based settings. Still, even the lowest-cost options in some counties remain above federal affordability guidelines, and rural families often face the added challenge of fewer licensed providers and long waitlists, making access as difficult as affordability.
The Uneven Burden of Child Care Across Oregon Counties
One way to see the burden is by comparing child care costs to income. Across Oregon counties, the cost of full-time, center-based infant care consumes between 10.4 % of median household income in Crook County and 21.2% in Josephine County. In Multnomah County, where costs are among the highest, infant care takes up nearly one-fifth (20%) of household income. Even in lower-cost counties like Umatilla, families still spend more than one in every ten household dollars on infant care. This section focuses on infant center-based care because it is the most expensive and least publicly subsidized form of care, while data for toddlers and preschoolers is included in the Appendix B.
Figure 3
Figure 4
Another way to measure affordability is in hours of work. In 2024, a parent earning the minimum wage in Multnomah County would need to work nearly 28 hours per week—well over half the full-time workweek—just to cover the cost of infant care. In Washington County, it takes about 26 hours per week at minimum wage, while in Hood River the figure is 25 hours. Even in counties with lower monthly costs, like Baker, parents earning minimum wage must still work 15 to 16 hours per week solely to pay for child care.1
Figure 5
Families earning the average county wage face a lighter, but still significant, burden. In Multnomah County, infant care requires roughly 12 hours of work per week at the average wage, while in Deschutes and Lane Counties the figure is around 10 hours. In rural counties such as Baker or Crook, child care takes closer to 6 hours per week at the average wage.
These figures show that child care costs are not just a budgeting concern—they directly shape how families allocate their work hours and whether full-time employment is feasible. For minimum-wage workers, especially in higher-cost counties, child care alone can consume over half a week’s earnings, leaving little room for housing, transportation, and other necessities.
Child Care Access: Too Few Seats for Too Many Kids
Across Oregon, licensed child care remains scarce for young children. For all children under age five, only one in three (33%) has access to a regulated slot. By definition, any county below that threshold qualifies as a child care desert—a place where more than three children compete for each available slot. The majority of Oregon counties fall into this category. [ii]
In a recent report from Oregon State University, the 2024 Oregon Child Care Desert, the authors highlight just how uneven this access is across the state. The strain is particularly severe for infants and toddlers: only 23% of children ages 0–2 statewide have access to a regulated slot, compared to 42% for ages 3–5. This gap underscores what the report calls the “acute shortage” of infant care—a pattern driven by the high costs and staffing ratios required for younger children.
The extremes highlight this unevenness. On the one hand, counties like Gilliam (57%), Wasco (48%), and Multnomah (45%) exceed the statewide average, with relatively stronger slot coverage. Yet these are exceptions. At the other end, counties such as Linn (18%), Tillamook (20%), and Harney (21%) show particularly limited access. In Linn County, there is less than one slot per five children under age five.
Taken together, the data show that access improves slightly for preschool-age children, but infant care remains the most significant availability issue across much of the state. For a more detailed look, county-level maps for ages 0–2 and 3–5 are provided in the Appendix B.
Figure 6
Child care capacity is limited in Oregon due to three primary factors: a lack of qualified physical space, a shortage of ready workforce, and challenges in building a sustainable business model without public subsidies. Workforce issues are paramount. According to a 2024 talent assessment produced by the Oregon Workforce and Talent Development Board along with the Higher Education Coordinating Committee, child care in Oregon faces a chronic worker shortage. At an estimated 12.6%, child care has the most extreme shortage of any industry. Nearly half of all firms surveyed mentioned a lack of child care as a key challenge for employee retention.
According to the 2022 Oregon Child care Workforce Study produced by the Department of Early Learning and Care, 60% of early learning programs are operating below capacity. Trained child care workers are difficult to retain for many reasons, including low pay and a lack of advancement opportunities. The median wage for head teachers in private center-based care falls between $16-22/hour, just over half of Oregon’s average annual salary. Over one quarter of early care educators screened above cutoff levels for clinical anxiety. According to the Workforce Study, 23% of the 2021 workforce left the field before 2022. With such a high rate of turnover and significant training requirements, workers are scarce.
Encouragingly, the lack of child care supply has lessened significantly in recent years across most regions of the state. Low birth rates have played a role, but most of the progress has been due to capacity increases fueled by public policy. Licensed capacity has increased to around 113,000 relative to 105,000 before the pandemic. Major reforms enacted in 2021 (HB3023) raised rates and increased eligibility for state subsidies, leading to a sharp increase in program participation. Additional funding for capacity building was provided by the legislature in both 2022 and 2023. A workgroup on permitting and zoning was created in 2023, followed by 2025 reforms that made it easier for providers to co-locate in facilities such as apartment buildings, churches and community centers.
Provider Licensing, Funding, and Geographic Access Analysis
Regulatory Burdens on Providers: Child care providers in Oregon face a complex set of regulations and approval processes. To become licensed and open a facility, providers must navigate multiple agencies – from state child care licensing rules to county zoning and city building codes – each with its own requirements.[iii] These overlapping regulations can conflict or be difficult to interpret, often forcing providers to hire consultants or endure lengthy approval timelines. For example, state licensing rules mandate certain facility standards (like minimum indoor/outdoor space per child and child-to-fixture plumbing ratios) that can trigger costly renovations. Many providers report that meeting these physical requirements – such as adding enclosed toilets or playground space – entails significant construction expense and delays, creating a high barrier to opening new centers. The result is a regulatory burden that can dissuade potential entrepreneurs from starting child care businesses and limit the expansion of existing ones.
Limits on Capacity and Staffing: Even when providers meet basic licensing standards, other rules constrain their capacity and financial viability. Oregon caps in-home (family) child care at 16 children, no matter how large the home or how many staff are available. If providers want to serve a 17th child, they must transition to a certified center – a shift that entails stricter building codes (e.g., installing fire sprinklers, ADA accessibility) and new zoning hurdles. Many home-based providers view the 16-child limit as “arbitrary and restrictive”, since they may have space to safely serve more children but are blocked by this rule.
Administrative Hurdles and Backlogs: Beyond formal regulations, administrative inefficiencies can impede the growth of child care services. Providers often encounter protracted timelines for licensing approvals, inspections, and background checks. For example, one state report in Nevada found that a licensing backlog of about 10 weeks was discouraging would-be child care workers and entrepreneurs, as they waited two to three months for the state to process their applications. [iv] This “long process for licensing” was cited as a major obstacle by both caregivers and businesses in that state.
Oregon has recently reorganized its oversight of early childhood care (launching a new Department of Early Learning and Care in 2023) to improve coordination, but similar challenges can arise here if licensing staff and systems are under-resourced. A slow background check or paperwork backlog means a qualified teacher might sit idle for months or a new center might miss its planned opening date – outcomes that worsen the supply crunch. Providers also point to high upfront costs and uncertainty during the licensing process. One survey found over half of Oregon providers had been hit with unexpected building upgrade costs in order to meet licensing and code rules, with many saying these expenses made it “difficult or impossible” to expand their businesses.[v] Unpredictable costs and delays (for permits, inspections, or occupancy certificates) increase the risk for providers, who may be paying rent or loans on a facility they can’t yet open. In sum, administrative barriers – whether slow processes or surprise compliance costs – can prevent otherwise willing providers from entering the market or growing their child care operations.
Geographic Disparities and Funding Support: Licensing and infrastructure costs—and the demands of regulatory compliance—are particularly challenging in Oregon’s rural and lower-income areas, where providers often operate with narrow margins. Child care supply is especially thin outside urban centers. In remote counties, providers may face large fixed costs and limited ability to charge sustainable tuition, making operations precarious. In many places, public funding has become essential to make care viable.
According to Oregon State University’s “Child Care Deserts” analysis, without public funding, all 36 counties would qualify as deserts for infants and toddlers—and for preschool care, more than three-quarters of counties would also be deserts. In rural counties, publicly funded child care slots typically represent a greater share of total capacity than in metro areas, helping providers in those places stay open.
To expand physical capacity, Oregon legislated new infrastructure support. In 2023, lawmakers passed HB 3005, which created the Child Care Infrastructure Fund (CCIF) and directed the Oregon Business Development Department (in coordination with the Department of Early Learning and Care) to administer grants and loans for child care facility development, renovation, repair, and expansion. The bill authorizes assistance for property acquisition, construction, capital improvements, and eligible administrative/technical costs for early learning infrastructure.[vi]
Under HB 3005, $50 million was allocated to establish the Fund, and the first $30 million was designated for rounds one and two of grant awards.[vii] The first round of infrastructure grants awarded approximately $10 million (per state press release) to support new or expanded child care facilities. Through this program, providers can receive capital support to help meet costly licensing standards—like facility upgrades or compliance with building, safety, or accessibility codes—that might otherwise be prohibitive.
These investments are already showing signs of impact. The OSU report notes that publicly funded programs have helped shrink the number of counties that are childcare deserts for preschool (ages 3–5). Still, infant and toddler care remain the most constrained segments: 34 of 36 counties remain deserts even with current funding interventions.
Together, these facts suggest that addressing Oregon’s child care shortage will require both easing unnecessary regulatory burdens on providers and strategically expanding financial support—especially in rural areas and for infant/toddler care—so that new centers and home-based providers can enter or expand where they are most needed.
Child Care Opportunity Index by County
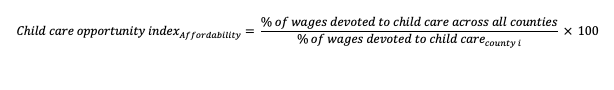
The Child Care Opportunity Indexcombines two components: affordability and availability.
Affordability. The affordability index is constructed relative to the statewide average share of wages devoted to child care. A value of 100 means a county is at the state average. Values below 100 indicate families spend a larger share of wages on child care than average (less affordable), while values above 100 mean child care is more affordable than average.
Availability. The availability index measures the number of licensed child care slots relative to the number of children at a certain age. A value of 100 means there is one licensed slot for every child. Values below 100 indicate a shortage, with fewer slots than children needing care. In practice, many counties fall far below a 1:1 ratio—placing them in “child care desert” status, where three or more children compete for each available slot.

Figure 7
Interpreting the figure
Figure 7 plots Oregon counties according to both measures. Counties to the left are less affordable than average, while those to the right are more affordable. Higher values on the y-axis indicate greater availability of licensed care. The four quadrants provide a way to interpret conditions:
- Top Right – Most desirable: more affordable and more available
- Top Left – More available but less affordable
- Bottom Right – More affordable but less available
- Bottom Left – Least desirable: less affordable and less available
Counties cluster heavily in the bottom quadrants, highlighting the dual challenge of high costs and limited supply. Two examples show how the extremes play out:
- Gilliam County lands in the top right quadrant, one of the few counties where child care is both more affordable (index 110) and relatively more available (43%).
- Multnomah County sits in the top left quadrant — child care is less affordable (index 78), but its availability (34%) is stronger than most counties, just above the “child care desert” threshold of 33%.
This contrast underscores how Oregon’s largest population center and one of its smallest counties face very different dynamics, yet neither offers families an easy balance of cost and access.
County rankings
Figure 8 depicts the combined Child Care Opportunity Index scores for Oregon’s ten most populous counties, focusing on infant center-based care (ages 0–2). Scores are calculated by summing affordability and availability, with higher totals reflecting stronger child care opportunities.
The results show that Oregon’s largest counties generally face steep challenges: most fall into child care desert status, with low availability dragging down their overall standing even when affordability is closer to average. Washington County ranks highest among the populous counties, though it still struggles with affordability below the statewide benchmark.
Two counties stand out as exceptions. Multnomah County, despite ranking low on affordability, narrowly avoids desert status thanks to availability levels just above the threshold. Linn County presents the opposite case—child care there is more affordable than average, but extremely limited availability leaves families with few actual options.
These findings underscore the tradeoff many Oregon families face: in most places, infant care is either less affordable, less available, or both. The appendix includes full results for all counties.
Figure 8
Tillamook County: A Rural Child Care Desert
Tillamook County illustrates the challenges facing rural Oregon families when it comes to child care. According to the 2024 Oregon Child Care Desert Report, the county qualifies as an extreme child care desert, with licensed providers able to serve only a small share of local children. For infants and toddlers ages 0–2, just 51 regulated slots exist—none are publicly funded. For preschool-age children (ages 3–5), there are 194 slots, nearly half of which (47%) are publicly funded. Altogether, the county offers only 245 regulated slots across all age groups, far below the number of children needing care. This severe shortage leaves most families without reliable options, forcing them to rely on informal care arrangements or travel long distances for child care.
Access has also shown little expansion over time. Figure 10 shows the share of children ages 0–2 and 3–5 in Tillamook County with access to a regulated slot compared with statewide averages, from 2018 to 2024. While Oregon as a whole has made gains, availability in Tillamook County has remained nearly flat for infants and declined for preschoolers, widening the gap between local families and the state overall.
The largest employer in the county, a 116-year-old food manufacturer, believes that the current funding structure is unsustainable. According to the Executive Vice President of People & Culture: “Child care is primarily funded by families that cannot afford the true costs associated with care for children. While parents are unable to afford care, child care providers are not charging enough to cover the costs to provide care, often subsidizing a lack of public investment in the system with their low wages.”
Survey data in Tillamook County found that 75% of employees missed 1-5 days of work per month due to child care issues. According to the firm, “Longer term solutions will require public-private partnerships and smart investments from the public sector”. To help address the issue, the firm has donated heavily to the local early learning center.
Figure 9
Costs further compound the problem. Figure 10 below displays the 2024 price of child care in Tillamook by setting and age group, along with the share of median family income devoted to care. Center-based infant care is the most expensive, consuming 14.6% of median family income—more than double the federal affordability benchmark of 7%. Even home-based infant care requires nearly 13% of household income. While preschool and school-age care are somewhat less costly, every age group remains above the federal affordability standard, underscoring the financial burden families face.
During interviews with CSI, cost concerns were cited repeatedly by households, providers, and the leisure and hospitality industry. Tillamook is a coastal county where there is a strong demand for vacation and rental properties. As a result, housing costs are out of line with the income of full-year residents. High housing costs deter many from entering low-wage child care jobs, with the effect of limiting supply. The lack of child care supply leads to higher prices. When combined with the high cost of housing, many workers are priced out of the region. This is of particular concern for the dominant leisure and hospitality industry where wages are low and additional workers are needed during the peak season and off hours.
Figure 10
Multnomah: High Access, High Costs
Multnomah County, home to Portland and the largest share of Oregon’s population, illustrates the dual nature of Oregon’s child care challenge. With nearly 820,000 residents, the county anchors the state’s labor market and is a bellwether for urban families’ experiences.
For infants and toddlers ages 0–2, there are 7,017 regulated slots, but only 10% are publicly funded. For preschoolers ages 3–5, the county offers 11,997 slots, with 22% publicly funded. Altogether, Multnomah provides about 19,014 regulated slots across all age groups, placing it well above the state average in terms of availability. From 2018 to 2024, the county saw notable improvements in both infant/toddler and preschool access, with coverage rates consistently stronger than Oregon overall (Figure 11).
Figure 11
This higher availability, though, comes at a steep price. Multnomah has some of the most expensive child care in the state. Center-based infant care costs about $23,475 annually, consuming 20% of median family income—nearly three times the federal affordability benchmark of 7%. Even home-based infant care takes up about 12% of income. While costs decline modestly as children age, center-based care for all age groups remains far above the affordability threshold. (Figure 12)
This contrast—greater availability paired with the state’s highest costs—underscores the tradeoffs facing urban Oregon families. In Multnomah, many parents can find a slot, but affording it often requires a disproportionate share of household income.
Concerns about the cost and availability of child care are pronounced for employers in the county that require workers in multiple shifts. Healthcare and technology firms both mentioned this as a major challenge. Of course, all hospitals operate on a 24/7 schedule. The county’s largest technology manufacturer reported that they also operate around the clock during periods of high demand.
Households in Multnomah County are encouraged by the ongoing implementation of universal preschool, which was supported by nearly two-thirds of voters. The program is slated to cover an estimated 11,000 children by 2030, funded by income taxes on high-income filers. Currently, there are around 2,000 children participating in the program, which is nearly as many seats as are supported by all other public sources. However, the universal preschool program is facing some pushback from many who are concerned about losing high-income households due to the tax burden, as well as by state policymakers who have concerns about overlapping programs at the state and local levels. There is also concern about the ability to expand capacity in time for universal coverage in 2030. Not only are child care workers scarce, but providers are reporting difficulty acquiring suitable physical space in many parts of the county.
Figure 12
What Happens to the Economy When More Parents Can Work?
The economic impact of increased (mostly female) labor force participation stemming from an increase in the availability of affordable child care. This was accomplished in five steps. It’s worth noting:
- First, using the Census Bureau’s American Community Survey, CSI estimated the number of children under age 6 grouped by the labor force participation rate of the parents. This results in approximately 78,000 parents with children under age 6 not in the labor force.[viii]
- Second, CSI assumed 15% of these households have an individual that would enter employment if child care was affordably available.[ix] This resulted in approximately 12,000 labor force entrants. With an unemployment rate of 5.0%, CSI assumed that 95% of the new entrants would be employed.
- Third, because a boost to the labor force participation rate changes the makeup of the labor force, CSI also entered the estimated change in the labor force participation rate equal to the new entrants into the labor market.
- Fourth, the model assumes a boost to output (production) from the new employees equal to the average output per worker.
- Fifth, the model assumed Oregon’s relative attractiveness for child care would induce a small increase in interstate economic migration of 0.5%.
Overall, the 2030 results are:
- A boost in annual jobs of almost 26,000 jobs.
- An overall increase in the labor force of almost 31,000.
- An increase to GDP of about $6 billion.
- An increase in Output (business sales) of $10 billion.
- A boost to Personal Income of about $1.6 billion.
- An increase to Disposable Personal Income of $1.2 billion.
Figure 13
Important to the economic results are that Oregon gains a greater share of economic activity by enabling—be it through regulatory reform to bring down the private cost of child care or some other method—more parents who want to work to be able to afford to work. As a case in point, the following result shows the increase in economic output for three competing states with Oregon. By increasing the labor force participation of individuals who want to work, Oregon sees a stronger boost to output than Colorado, Arizona, or Iowa.
Figure 14
The boost in economic activity may generate revenue for the state. Using the gain in Personal Income, Gross Domestic Production, and Disposable Personal Income as the guideposts and applying the change in these estimates to the September 2025 revenue forecast for the 2025-2027 budget, the boost to revenue is approximately $104 million over the period, or an increase of 0.3% to the current budget baseline, as shown in the following figure.[x]
Figure 15
Appendix A
Wage Assumptions Used in Affordability Calculations
Affordability estimates in this report are based on Oregon’s tiered minimum wage schedule and statewide average wages.
- Minimum Wage (July 1, 2025 – June 30, 2026) : Oregon uses a three-tier minimum wage system:
- $16.30/hour – Portland metro (within the urban growth boundary, including parts of Clackamas, Multnomah, and Washington Counties)
- $15.05/hour – Standard counties (Benton, Clatsop, Columbia, Deschutes, Hood River, Jackson, Josephine, Lane, Lincoln, Linn, Marion, Polk, Tillamook, Wasco, Yamhill, and parts of Clackamas, Multnomah, and Washington Counties outside the UGB)
- $14.05/hour – Non-urban counties (Baker, Coos, Crook, Curry, Douglas, Gilliam, Grant, Harney, Jefferson, Klamath, Lake, Malheur, Morrow, Sherman, Umatilla, Union, Wallowa, Wheeler)
Source: Oregon Bureau of Labor and Industries (BOLI), Minimum Wage Rates
Average Wages
The statewide average wage is based on data from the U.S. Bureau of Labor Statistics, Current Employment Statistics (CES):
Average Hourly Earnings of All Employees: Total Private in Oregon (series ID SMU41000000500000003, not seasonally adjusted).
This measure reflects earnings across the private sector in Oregon and provides a benchmark for “average wage” affordability calculations.
Appendix B
Child Care Affordability by Age Group
Figure B.1
Figure B.2
Child Care Availability by Age Group
Infant Care (Ages 0–2)
Infant care is the most strained segment of Oregon’s child care system. Only 23% of children ages 0–2 statewide have access to a regulated slot. Several rural counties, including Harney and Wheeler, report no regulated infant care at all. By contrast, Gilliam County stands out with 43% availability, well above the state average.
Figure B.3
Preschool-Age Care (Ages 3–5)
Access improves somewhat for preschool-age children. Statewide, 42% of children ages 3–5 have access to a regulated slot. Larger counties such as Multnomah (57%) and Union (58%) perform above average, while Linn (24%) and Yamhill (27%) lag behind.
Figure B.4
Child Care Opportunity Index by County
Figure B.5 ranks Oregon counties by their combined Child Care Opportunity Index scores for infant center-based care (ages 0–2). Scores are calculated by summing each county’s affordability and availability values, with higher totals reflecting stronger child care opportunities. The results highlight how few counties perform well on both measures. Most fall into child care desert status, split between those that are more affordable but still lack sufficient slots and those that are less affordable with equally limited availability. Outliers include Multnomah, which is less affordable but just above the desert threshold, and Gilliam, the only county to combine stronger affordability with relatively higher availability.
Figure B.5
[ii] Oregon State University, College of Health. (2024). Oregon’s child care deserts 2024: Mapping supply by age group and percentage of publicly funded slots. Oregon State University.
[iii] https://www.oregon.gov/lcd/ChildCareFacilities/Documents/2024-07-19-Final_Barriers_and_Opportunities_Memo.pdf
[iv] https://gowinn.nv.gov/wp-content/uploads/2023/07/02-15-2023-Minutes.FINAL_.pdf
[v] https://www.oregon.gov/lcd/ChildCareFacilities/Documents/2024-07-19-Final_Barriers_and_Opportunities_Memo.pdf
[vi] https://olis.oregonlegislature.gov/liz/2023R1/Downloads/MeasureDocument/HB3005
[vii] https://www.oregon.gov/biz/programs/child_care_infrastructure/pages/default.aspx