Colorado is an increasingly expensive place to live. Housing prices are surging, and affordability is decreasing. Though there has been a recent increase in building permits, the current housing supply shortage is so large that the increased construction of new homes must be sustained for years, if not increased, to overcome the shortage. Furthermore, recent history shows new home construction is concentrated on single-family homes, the least affordable option.
Key Findings:
- Inflation - Official housing inflation data understates the genuine cost to homebuyers. The BLS inflation number for housing, as a part of the consumer price index, was 5.1% YoY for January 2022. Data from the Colorado Association of Realtors shows the median price of single-family homes increased 19% and townhouse/condos increased 17% over that same period. The Case-Shiller index showed housing prices increased 17.7% YoY.
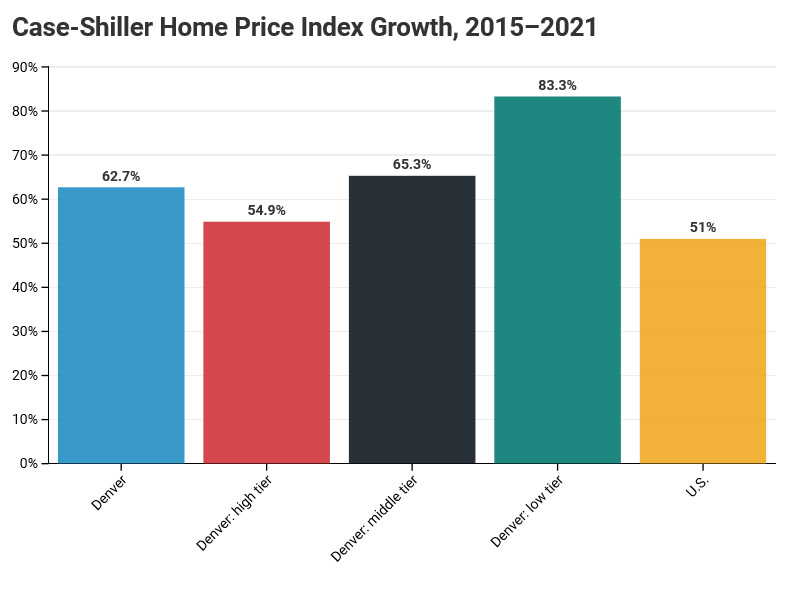
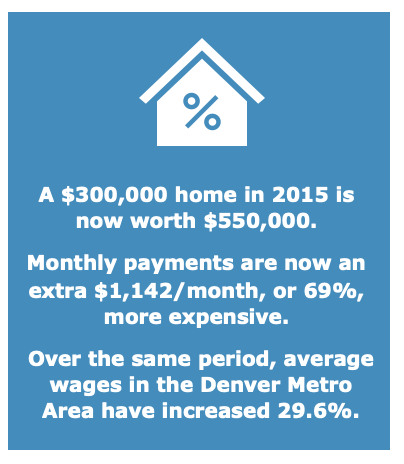
- Case–Shiller Home Price Index - Prices of starter/lower-cost homes have increased 83.3% since 2015. Prices of homes in the Denver metro area, as measured by the Case-Shiller (CS) Home price Index have been higher than the U.S. average since November 2015, and have increased 70%, 11 percentage points higher than the U.S. overall. Prices in the lowest cost tier of housing that CS tracks have increased the most since 2015, by 83.3%. For example, a $300,000 home in 2015 that increased 83.3% by 2022, is now worth $550,000. The impact on a monthly mortgage payment for the same house bought in 2015 compared to 2022, assuming 10% down payment and equivalent rates on a 30-year mortgage, is now an extra $1,142/month, or 69%, more expensive. Over the same period, average wages in the Denver Metro Area have increased 29.6%.


- Colorado Association of Realtor Affordability Index - Housing is half as affordable as it was 7 years ago. Housing affordability continues to deteriorate, from 2015 to February 2022, the Colorado Association of Realtors Affordability Index[i] for Colorado declined by 45.4% for single family homes and 43.4% for Townhouse/Condo’s. Affordability in the Denver Metro Area is even worse. For single family homes the affordability index declined 50% and 55.6% for Townhouse/Condo’s.
- Rent - A larger share of household budgets is going to housing. Average wages are not keeping up with the cost of renting. Since 2015, the average rent in Colorado increased $317 (29%) and $469 (36%) in the Denver Metro area while the average hourly wage in Colorado has increased 25.3% and 29.6% in the Denver Metro area.
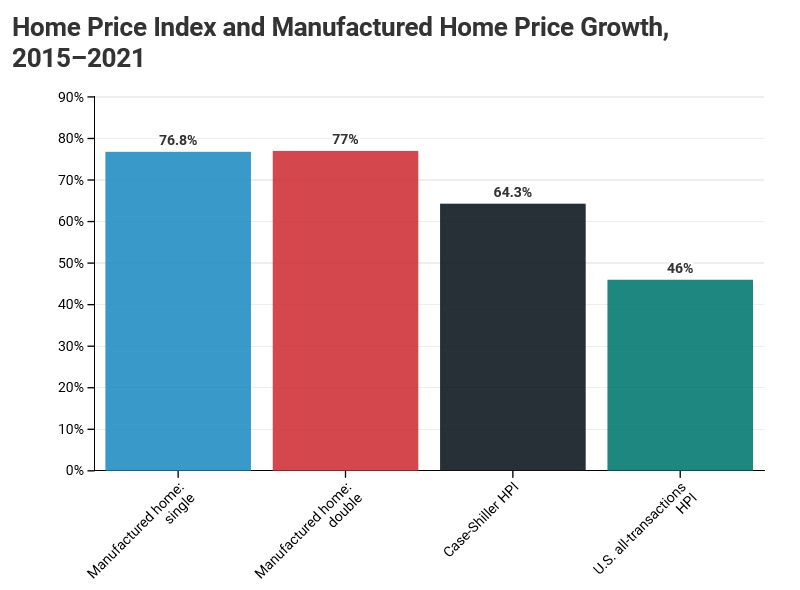
- Manufactured homes – Prices of newly manufactured homes have soared. Manufactured homes have typically been a more affordable option for people who want to own their own home. However, national price data since 2015, shows the average sales price of a new single-wide home has increased 76.8% and 77% for a double-wide home.[ii]

- Colorado continues to add to the stock of the least affordable residences. Over the period 1990 to 2020, based on the number of taxable residences (assessed residential properties), the share of single-family homes has increased by 697,193 and accounts for 76.1% of residential stock. More affordable residential options including manufactured housing/parks, duplexes/triplexes, multi-units (4 & up-8), and condominiums have declined by 64,724, and now account for 23.9% the total residential housing stock.
Drivers of Housing Prices – Homes prices are affected by supply and demand dynamics and construction costs
- Construction costs – Nationwide, construction costs for housing are a major factor in increasing housing prices. Since 2015, construction costs of a new single-family home increased 49.6% and 29.9% for new multi-family homes.[iii]
- Producer price index goods and services and construction labor costs - Nationwide inputs to new residential construction for goods increased 45.2% and services 51.5% from 2015 to February 2022.[iv] Labor costs for residential construction have increased 26.5% over the same period.[v]
- Building Permits - New construction permits surged in 2021 by 26% to 59,500 and increased in the Denver MSA by 51%. CSI estimated we needed more than 54,000 new housing units every year for the next five years to return the market to the long run housing to population ratio.[vi]
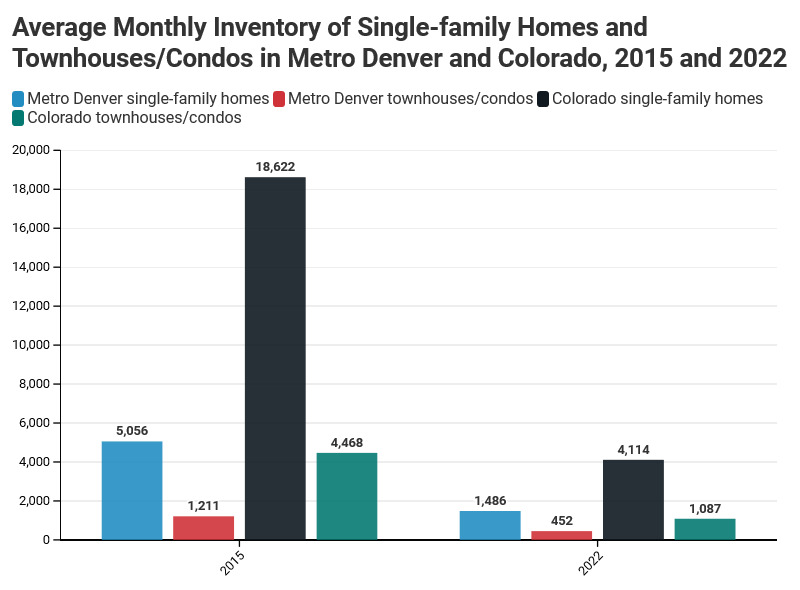
- Inventory of homes for sale – From 2015 to 2020, the monthly inventory of active listings in Colorado have declined 78% and 76% for single family homes and townhouse/condos. For the Denver metro area, the declines are 71% and 63%.

© 2022 Common Sense Institute.
[i] Housing Affordability Index – A measure of how affordable a region’s housing is to its consumers. A higher number means greater affordability. Conversely, a lower number means less affordability. The index is based on interest rates, median sales price and average income by county.
[ii] U.S. Census Bureau, Average Sales Price of New Manufactured Homes: Single Homes in the United States [SPSNSAUS], retrieved from FRED, Federal Reserve Bank of St. Louis; https://fred.stlouisfed.org/series/SPSNSAUS, March 23, 2022, U.S. Census Bureau, Average Sales Price of New Manufactured Homes: Double Homes in the United States [SPDNSAUS], retrieved from FRED, Federal Reserve Bank of St. Louis; https://fred.stlouisfed.org/series/SPDNSAUS, March 23, 2022. S&P Dow Jones Indices LLC, S&P/Case-Shiller U.S. National Home Price Index [CSUSHPINSA], retrieved from FRED, Federal Reserve Bank of St. Louis; https://fred.stlouisfed.org/series/CSUSHPINSA, March 23, 2022. U.S. Federal Housing Finance Agency, All-Transactions House Price Index for the United States [USSTHPI], retrieved from FRED, Federal Reserve Bank of St. Louis; https://fred.stlouisfed.org/series/USSTHPI, March 23, 2022.
[iii] U.S. Census Bureau
[iv] U.S. Bureau of Labor Statistics, Producer Price Index by Commodity: Inputs to Industries: Net Inputs to Residential Construction, Services [WPUIP2311002], retrieved from FRED, Federal Reserve Bank of St. Louis; https://fred.stlouisfed.org/series/WPUIP2311002, March 23, 2022.
[v] U.S. Bureau of Labor Statistics, Average Hourly Earnings of Production and Nonsupervisory Employees, Construction [CES2000000008], retrieved from FRED, Federal Reserve Bank of St. Louis; https://fred.stlouisfed.org/series/CES2000000008, March 23, 2022.
[vi] https://commonsenseinstituteco.org/co-housing-blueprint/