Inflation in Colorado - January 2026 Update
Denver Prices Rise Again through January
After falling by 0.64% between September and November, Denver’s price level rebounded by 0.58% across December and January. Although this is the highest two-month inflation to begin a calendar year since 2023, it looks more like a correction of high deflation over the previous period than a sign of new inflationary pressure. Prices in the Denver metro area are now 2.6% higher than they were a year ago—up from 2.2% as of November—but still lower than they were in September. Seasonal patterns indicate that late-year deflation followed by early-year inflation, although magnified in both directions this year, is normal in Denver.
The U.S Federal Reserve’s decision to cut the federal funds rate in September helps to explain price decreases since then, but recent figures may be less reliable than usual. The October government shutdown complicated the BLS’ data-collection process, leading economists to receive November’s results with more caution than usual. A high rate of inflation in January’s report, therefore, might supply some evidence that November’s figures were indeed imprecise.
Key Findings:
- The price level in the Denver metro area rose by 0.58% between November and January, registering the highest December–January growth rate since 2023. Nationally, prices rose by 0.35% over this period.
- Over the last 12 months, prices rose by 2.62% in the Denver MSA and 2.39% nationally.
- The prices of medical care, services, and housing increased by 6.7%, 3.8%, and 3.6%, respectively.
- After rising by 8.3% over the year prior, transportation prices in Denver fell by 2.3% between January 2025 and today. This appears to be a partial result of falling gasoline prices, which also contributed to a 9.1% decline in local energy prices over the last year.
- Despite reaching 2.1% across the last two months, food inflation in the Denver MSA remains below the national average. Over the last year, the price of food rose by 2.2% in metro Denver and 2.9% across the country.
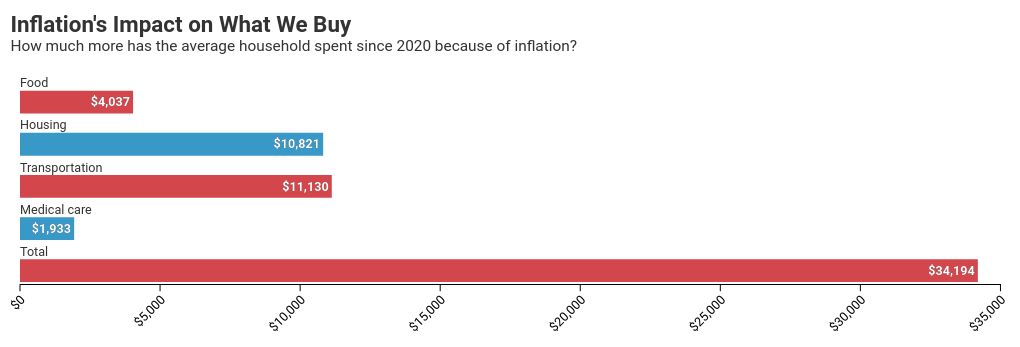
- The average Colorado household has cumulatively spent $60,233 more since 2020 because of inflation.[i]
Inflation in metro Denver over the last 12 months was 2.62%, while the national average was 2.39% (BLS CPI Survey).[ii]
- Of the 23 urban consumer price indices tracked by the BLS, Denver–Aurora–Lakewood ranks 9th in total growth since the end of 2021.
- The price of energy in the Denver MSA fell by 7.4% over the last two months to its lowest level since early 2021.
- The price of medical care grew by 6.7% over the last year, the most of any consumer good in Denver.