Read the Press Release
Introduction
Arizona and New Mexico, which are both progressive reform-era states, had one of the largest and most restrictive K-12 land trust grants in terms of total size and as a share of their states. The result has been less development and missed opportunity. In fact, about 84% of Arizona’s original land grant remains trust land, and more than 80% of that land is used for grazing, general rights-of-way such as roads or utilities between other properties, or other low-intensity purposes. The average annual return to Arizona’s K-12 beneficiaries? Just $8.40 per acre per year. As a result of these and other development restrictions, most of Arizona’s urban and economic development, and nearly all its people, live and work on less than one-fifth of the state’s land area.
In prior decades, the Arizona State Land Department (ASLD) acknowledged its failure to productively manage this resource, and was more aggressive in pursuing commercial development, making the land saleable, and bringing land to market. As a result, the state’s K-12 financial trust has grown rapidly – from $811 million in market value in 1995 to $8.7 billion today. But progress has been slow and hampered by stringent regulations imposed on the ASLD by federal and state mandates.
This paper identifies the historical cost of mismanagement to Arizona’s K-12 system and other Land Trust beneficiaries: $134 billion in lost distributions over the last century. It also explores the potential benefits of fixing this issue going forward, in terms of both increased distributions to beneficiaries (like state public schools) and increased economic opportunities for the state’s 7 million residents. Arizona has grown quickly, more than doubling its population over the last 30 years. Home prices have grown more than 40% since the pandemic, and land – particularly in exurban parts of the Phoenix metro – is increasingly valuable but often difficult to legally develop.
Stringent legal requirements – an onerous auction and appraisal process, a “highest and best use” subjective legal standard, and political interference like the recent prioritization of social and green causes by ASLD in selling and using land – have been substantial impediments to reasonable and productive management. As a result, Arizona has more than 9 million acres of total Land Trust today, including more than 8 million in K-12 Land Trust. In comparison, California has less than half a million in land trust. Hawaii and Alaska, the two states added to the Union after Arizona, have no K-12 trust set-asides.
Key Findings
- Today, 9 million acres, 13% of the state’s landmass, are owned by the State Land Trust. In practice, most of this land is largely idle and undeveloped, even though CSI estimates that more than a third of it is proximate to urban areas and potentially developable.
- Over the last century, Arizona’s K-12 Land Trust has produced $5.8 billion in distributions to beneficiaries and an estimated $19 billion in net remaining asset value. Had the state instead sold its land grant in a timely manner and deposited the proceeds into its Permanent Fund, the K-12 Trust today could have been worth $163 billion and distributed $140 billion to beneficiaries.
- There is still an opportunity to correct this policy error. Rapid growth has made much of this land very valuable. CSI estimates that the ordered sale of remaining trust land over the next decade would generate $18.5 billion in revenue and $55 billion in new economic activity and support the development of 1 million new housing units over 20 years.
- Public services benefit, too, generating an additional $65 billion in distributions to public schools over the next 50 years, and $5 billion a year in new state and local tax revenue.
What Are State Trust Lands and Why Have Them?
Since nationhood, the United States has had a system for disposing the national public domain to private settlers and local governments when new states were created. The General Land Ordinance of 1785, Northwest Ordinance of 1787, and other early federal policies systematized this process, including by reserving some public lands for the support of schools, and the transfer of title to these reserved parcels on statehood.
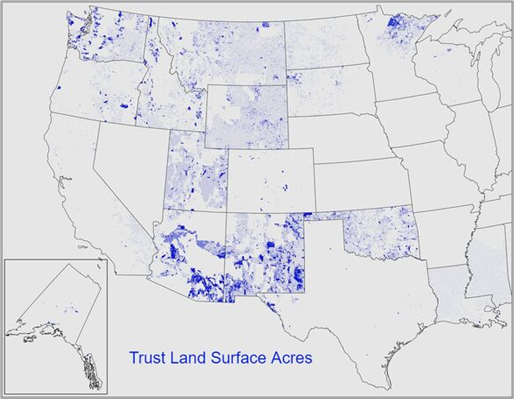
FIGURE 1
FIGURE 2
FIGURE 3
While these parcels were to be held in trust by the state government for the benefit of common schools, the amount of land received, and its long-term treatment, varied depending on the year of statehood, and the specific terms Congress applied to that state’s land grant.
Arizona and New Mexico were the final states admitted to the Union using this structure and given statehood during the peak of the Progressive Era. About 10,960,000 acres – almost 15% of the entire state, including more than 13% that was specifically designated for K-12 education – of Arizona’s land was set aside at statehood for the benefit of 13 beneficiaries (predominantly public schools).
Most of this land remains locked in the Land Trust and mostly un- or under-utilized today.
See Appendix A for an accounting of all trust lands, by state and year of statehood remaining today.
|
The State of State Trust Land
4.9%
Other States’ Land Trust at Statehood
36%
Other States’ Share of that Grant Remaining as Trust Land Today
15%
Arizona’s Land Trust, as a Share of All Land at Statehood
84%
Arizona’s Share of that Grant Remaining as Trust Land Today
|
State Trust Land vs. Other Public Lands
As noted in an earlier portion of the report, ASLD holds roughly 13% of all the state’sland in the Trust on behalf of public beneficiaries, with the majority of that land (8 million acres) held for the benefit of the state’s K-12 system.
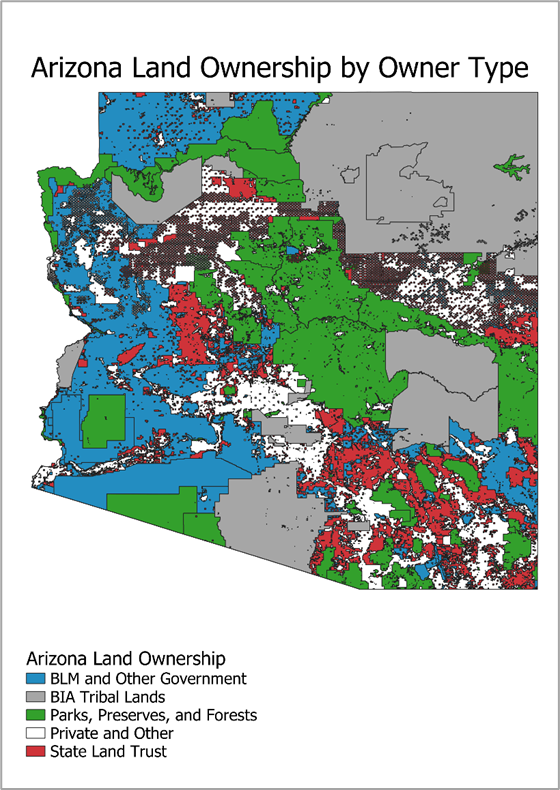
The Trust is just one component of state public lands, however. Federal and tribal governments additionally hold significant portions of the remaining land. In total, about 83% of Arizona’s land is owned by either state or federal entities or Indian tribes, leaving only about 17% owned privately and available for ready development.
In terms of acres, approximately 60 million acres are publicly held: 30.6 million acres are held by the federal government, including nearly 28 million acres specifically set aside for recreation, grazing, or preservation. Another 20 million acres are held by the state’s 21 recognized tribal governments.
Arizona’s Land Trust generally, and its common schools grant specifically, is by far the largest source of public land.
Considered together and in summary: 83% of all land in Arizona is publicly held, with 11% in trust for pubic beneficiaries. This fact limits the state’s development potential, and that constraint will grow more binding over time absent reform.
FIGURE 4
Permanent Funds and Their Relationship with State Land Trusts
While the core function – to generate revenue for designated beneficiaries – of state land trusts has remained consistent, since the early 19th century, states have struggled to balance competing goals. They are supposed to generate immediate investment in their nascent public services, like K-12 education, while preserving long-term trust valuations for the benefit of future generations and enabling their states to grow and develop privately. Early state trust land policies often emphasized immediate returns, leading to rapid land sales that established early public-school systems and strong economic foundations, but arguably missed opportunities for long-term, dedicated land trust funding.
FIGURE 5
The absence of “permanent” funds to house proceeds of trust land sales compounded these issues. Without mechanisms to invest and grow proceeds from land sales, states that quickly sold their trust land exchanged immediate investment in beneficiary public services and greater opportunity for development and economic growth for greatly diminished future trust land revenue-generating capacity. In 1837, Michigan became the first state admitted to the Union that, in addition to receiving a land grant for support of its common schools, also established a fund to house permanent revenues attributable to that grant (e.g., proceeds from land sales). This change would carry forward into Arizona’s statehood structure.
Revenues generated from the sale of state trust lands in Arizona are deposited into the Permanent Land Endowment Trust Fund (PLETF), managed by the State Treasurer’s Office – as opposed to ASLD, which oversees the LandTrust. Though often referred to as a single large fund, the PLETF is composed of 13 distinct accounts, each of which is designated for a specific beneficiary. As of 2024, the Common Schools Fund accounted for 93.3% of the PLETF’s total market value, making it by far the largest component. Not coincidentally, this number roughly mirrors the distribution of land by beneficiary in the 1912 trust grant.
Although the PLETF differs from the physical land still held in trust, the value of both can be thought of together as forming the corpus of the overall State Land Trust. While the total value of physical land may diminish through land sales, the PLETF is constitutionally protected and cannot be spent – meaning that value is preserved rather than lost, but the state’s opportunities may change. For example, the state could free more land for private development and shift the state’s asset weight toward financial instruments with greater appreciation potential and lower management costs.
Unlike expendable revenues such as lease income, which flow directly to beneficiaries each year, proceeds from land and mineral sales are added to the fund’s principal and are invested by the state treasurer’s office. Over the last 20 years these investments have yielded an average annual return of 7.8%. For context, the average annual return in the Dow Jones Industrial Average over the same period was about 11%. Expendable revenues grew at an average annual rate of just 1.3%over that period. Beneficiaries also receive distributions from the PLETF based on a statutory formula designed to preserve the fund's long-term value while generating stable support for public services. These distribution formulas have evolved over time in response to economic conditions, legal rulings, and policy reforms.
Proposition 102 (1998)
Prior to 1998, distributions from the PLETF were based on a five-year average of inflation-adjusted investment returns, which notably excluded capital gains or appreciation in the value of fund assets. At that time, the state treasurer was also prohibited from investing in securities like equities which severely constrained potential returns. This structure resulted in unpredictable, volatile distributions and low PLETF performance and return rates that, ironically, mirrored the state’s poor performance with its physical land.
Recognizing the flaws in this approach, a major shift occurred in 1998 with the introduction and passage of Proposition 102, which allowed the treasurer to begin investing PLETF assets in a broader array of financial instruments, including up to 60% equities. The measure also authorized the inclusion of capital gains in calculating trust income. While these changes improved the long-term performance of the PLETF, it did not resolve volatility in annual distributions.
Proposition 118 (2012)
At the request of then-Treasurer Doug Ducey, in 2012 Arizona voters approved Proposition 118, which replaced the previous return-based formula with a fixed-rate distribution equal to 2.5% of the five-year average market value of the PLETF. This reform was designed to smooth the sharp year-to-year fluctuations seen under the prior system, providing more predictable funding while preserving or modestly increasing average distributions so underlying fund trends would not meaningfully change.
Proposition 123 (2016)
Most recently, in 2016, Arizona voters passed Proposition 123 in part to resolve a long-running lawsuit alleging the state underfunded the K-12 funding formulas during the Great Recession. The measure increased the distribution rate from 2.5% to 6.9% for 10 years, significantly increasing school formula funding as compensation for reductions during prior years. This adjustment resulted in $3.7 billion in cumulative additional revenue for Arizona schools through fiscal year 2025.
Despite more than doubling the distribution formula, the value in the PLETF has increased exponentially since passage of Proposition 102 due to the rapid pace of capital appreciation allowed by a growth- and risk-balanced investment strategy. In the 5 years prior to and after the passage of Proposition 123 the market value of the Common Schools Permanent Fund increased 58% and 48% respectively – meaning that while the higher distribution rate may have reduced corpus growth, it did not eliminate that corpus or reduce the funds real value over time.
FIGURE 6
Trust Management in Arizona
A product of its statehood land trust, Arizona manages two separate assets for the benefit of K-12 education and other federally-designated beneficiaries: the Land Trust, consisting of approximately 11 million acres of physical land granted to the state in 1912, but legally set aside to be used for the benefit of the state’s public schools; and the PLETF, which is a financial account consisting of permanent funds attributable to the use and disposition of these physical lands. Again, the Land Trust is managed by the Land Department, while the PLETF is managed by
the State Treasurer .
Because of a perception by some policymakers that prior land grants tostates had been disposed of too quickly following statehood, and popular progressive era views that preferred permanent central public management, when Arizona and New Mexico became states, Congress imposed much more stringent legal provisions. Unlike earlier grants, Congress was explicit: these lands were “held in trust,” and any use “contrary” was a “breach of trust.” This shift created a substantial legal liability for Arizona generally – and its Land Department specifically – since the trustee’s fiduciary relationship has a long and complicated common law history.
Arizona’s administrative responses to this designation included constitutional and statutory mandates that protected the Trust from premature or “undervalued” disposal. Arizona prohibits any kind of mortgage or other legal encumbrance of the land altogether; land must either be sold or leased to the “highest and best bidder” at public auction. But before a sale can proceed, an appraisal at “true value” must be ordered, and the land cannot be sold for less than its appraised value. Finally, and critically, unlike many states, Arizona created a fund, the PLETF, to hold in perpetuity the permanent revenues from the sale of trust lands. This fund acts as a kind of perpetuity comparable to the land itself – an asset capable of long-term compound growth that makes annual cash distributions to designated beneficiaries, but that is protected by the high legal bar of trust and trustee.
Arizona’s trust obligations are not paper mandates but are, unlike in previous states, legally and independently enforceable by a variety of third parties, including the U.S. Attorney General. Later Supreme Court rulings affirmedthe more stringent rules guiding Arizona’s management of the trust.
Land Trust Management. The leasing and disposition of trust land, especially urban trust land, is subject to extensive planning by the ASLD, including onerous and restrictive five-year “conceptual use plans” and “disposition plans” which largely dictate what parcels of trust land will be sold and when.
While on the surface these restrictions seem reasonable to prevent alleged fire sales or to preserve the public domain, they make the process of using the land for the financial benefit of the trustees – and the general benefit of all Arizonans– much more time-consuming and difficult. This situation is particularly problematic if one considers how much land was set aside in the state’s Land Trust – more than twicethe average relative acreage reserved in all states – and how much is owned by public owners more generally. These restrictions practically limit Arizona’s opportunities for growth and development. Whereas earlier states were able to sell, encumber, or otherwise divest themselves of their physical land grants relatively quickly and productively, Arizona and New Mexico have held onto most of their physical trust land. In the 66 years between 1912 and 1978, the amount of land held in trust for Arizona’s K-12 system increased 3% thanks to the addition of in-lieu and indemnity lands to the trust over the years. As of 2024 – 112 years after the state’s birth – Arizona still holds title to 85% of its original K-12 trust land endowment.
For perspective, of the 29 states with land trust set asides created at statehood, just 7 states retain at least half of that original grant.
This vast acreage is managed by ASLD, ostensibly for the benefit of the public schools. In practice, the land was almost entirely idle before the 1980s; even today, most of this land sees little development or use. By law, ASLD distributes receipts and revenues attributable to the productive use of this land to beneficiaries (or, if permanent, deposits them into the PLETF). In 1998, the Land Trust earned $14.3 million from land leases and other expendable revenues; last year, the Trust earned $67.4 million. For context, the entire K-12 budget in Arizona is $16.2 billion. Distributions from the PLETF reached $424.2 million in 2024 (530% more than from the Land Trust), up from $57.3 million in 1998.
FIGURE 7
While high-profile long-term lease activity has recently resulted in strong returns to Land Trust beneficiaries – for example, the long-term lease and subsequent sale of Desert Ridge in northern Phoenix by private commercial property
developers
– this practice is relatively modern; the state did not really begin developing valuable trust land for lease or sale until the 1980s following the passage of the Urban Lands Act.
For most of the Trust’s history, nearly all the land has been idle and undeveloped – used for grazing, light agriculture, or general and recreational use. These uses have created little value for either the state generally or designated beneficiaries. And clearly, the strict legal standards imposed on ASLD – and threat of litigation or personal liability – has contributed to this conservative posture.[xxiii]
More recently, political risk has been introduced, shifting the goal of trust management away from value maximization for beneficiaries in some instances to the pursuit of other ends. ASLD in its annual reporting now identifies “focus” areas, including solar leases and housing projects, that may reflect political priorities of ASLD leadership and state elected officials rather than the “highest and best” interest of beneficiaries. On the other hand, as particular uses become disfavored politically – for example, alfalfa farming during periods of growing sensitivity about water – the state may feel it necessary to limit such activities, regardless of their true economic merit.
Permanent Fund Management
As discussed earlier, Arizona protects the total value of its statehood land grants for legally entitled beneficiaries. The total scope of this Trust is reflected not just by the volume or value of physical land held by the state, but also by the financial value of permanent funds derived from this land over the past century. These permanent funds are held in the PLETF financial accounts and managed by the Treasurer’s Office.[xxvi]
Today, the treasurer manages more than $9billion in financial assets on behalf of K-12 public schools and other beneficiaries.
Continuing to hold most of the original grant value in the form of physical land has dramatic consequences for beneficiaries and the state generally, since most beneficiary distributions from the original trust grant come from PLETF and not the Land Trust. At the same time, development of the Land Trust has been limited at best; even today, more than 80% of the land is used for grazing or open access areas.
By 1998, the annual distribution from the PLETF (e.g., financial assets) to public schools was nearly four times larger than the revenues generated from lease and other expendable revenue sources (e.g., physical land assets), despite the Trust retaining more than 86% of the original Common Schools physical land endowment. By 2024, the Common Schools Fund was more than six times larger – again, doing much more but with a fraction of the original asset value.
On average, the PLETF returns over 7-8% per year on its investment pool, and by law distributes 2.5% of this pool to beneficiaries. Between 1998 and 2024, the value of the Common Schools PLETF grew nearly 10-fold from an estimated $843 million to $8.1 billion while distributing a cumulative $3.9 billion to beneficiaries. For context, the Land Trust distributed just $1.5 billion in expendable revenues over the same period.
FIGURE 8
This loss of revenue potential is further compounded by the costs associated with maintaining and managing trust land that remains in the state’s possession. The ASLD currently expends $25 million in resources each year to maintain this vast acreage, including more than$12 million from the State’s General Fund. Management costs for the PLETF by the treasurer are estimated at $2 million per year.
Unlocking the Potential of Trust Land
Because the development potential for more than 80% of Arizona land is limited due to some form of public ownership and management, growth has been concentrated in urban and privately managed corridors around greater Phoenix and Tucson. While the amount of land has been enough historically to keep up with demand, more recently the urban Phoenix metropolitan area has begun to encroach upon its boundary. Indeed, even as of 2006, up to 30% of the developable land in Maricopa County and the fast-growing Phoenix metro was owned by the Land Trust. Most of these properties are concentrated in the exurban areas, north or west of the 101. Once open desert is now quickly being sub-urbanized. At least 58% of all land in Maricopa County is owned by federal, tribal, or other state and local government entities.
Currently, CSI estimates there are a total of 276,700 acres of potentially unleased trust land within a 10-mile radius of Arizona’s incorporated cities and towns, enough for more than 200,000 housing units. Including agricultural and grazing land within the same distance – land which currently commands very low value for trust beneficiaries in terms of annual per-acre lease revenues– up to 3 million acres of potentially developable trust land are present in or around already developed population centers in the state.
FIGURE 9
According to ASLD, only about 80,000 acres of trust land are currently under commercial lease across the entire state. For context, there are about 9.2million acres of trust land in total as of 2024. Again, the vast majority (83%) of Land Trust leases are for grazing or general use and access of land that, by definition, is undeveloped.
This fact suggests that there are significant underutilized economic development opportunities in and around Arizona’s fast-growing population centers. The numbers are particularly striking given the state’s immediate need for another 50,000-100,000 housing units. Several studies have found that land use restrictions and other regulations limiting the supply of buildable land lead to increases in real estate prices. Similarly – and especially relevant in the current building environment – rising construction costs further erode builder margins, making land costs either an opportunity or a liability, depending on whether the state can improve the quantity available for construction of the kind of suburban, single-family homes most people want. Even if the availability of physical land was not a binding constraint on the construction of new homes – a notion that seems increasingly implausible – supplying more land for private development would still put downward pressure on land prices, and in turn facilitate the building of more affordable housing while unlocking greater future growth potential.
Despite this potential, the Land Trust has proven sclerotic towards private development. As early as the 1980s, the ASLD acknowledged the untapped value of trust land – particularly in urban areas – and sought reform. With passage of the Urban Lands Act, it tried to better identify and manage potentially developable trust lands, and either sell them or make them available to long-term leases. While the high prices commanded for lands successfully sold or leased under these agreements confirms the opportunity is real, the pace of sales has remained uninspiring. Since 1998, ASLD has sold just 101,600acres of trust land and initiated 588 acres in new commercial leases.
Despite a growing effort toward reform over the last 40 years, the state has proven that managing its Land Trust is expensive, creates massive opportunity costs for beneficiaries relative to instead managing a larger permanent fund, and imposes costs on the public generally in terms of reduced private development, foregone economic growth, and higher housing prices. Even assuming that trust land outside of urban areas is already being used in an economically optimal manner – a big assumption – and that the economic potential of privatizing all trust land relative to the baseline only occurs on developable parcels within 5 or 10 miles of a city or town, CSI’s econometric model shows potential massive benefits from privatization.
Economic Impacts of Selling Trust Land
To evaluate the economic benefits that could accrue to theArizona economy as a result of selling state trust land versus continuing to hold it, CSI considered two scenarios. The “high” scenario assumes the sale and development of all potentially developable state trust land within 10 miles of Arizona’s incorporated cities and towns. The “low” scenario restricts this evaluation to land within 5 miles.FI
FIGURE 10
Using current land use data analyzed through ArcGIS, we estimate that approximately 1.6 million acres of potentially developable trust land lie within 5 miles of an incorporated area, with an additional 1.4 million acres between 5 and 10 miles – totaling roughly 3 million acres. Of this, CSI estimates that about 2.1 million acres are physically developable within the 10-mile range, and 1.2 million acres are developable within the 5-mile range. These figures exclude land that is steep, mountainous, or otherwise unsuitable for residential, commercial, or industrial development. In short, this analysis focuses on land that satisfies three criteria: it is legally developable (it would be privately owned and privately accessible), practically developable(it is proximate to existing urban infrastructure and public utilities), and physically developable.
Of the developable land, CSI assumes that approximately 54% would be used for residential development. That number reflects the current distribution of land uses in developed Arizona as estimated by CSI. The remaining 46% would be allocated for commercial, industrial, or other uses. Based on these assumptions, we estimate the land could support between 800,000 and 1.4 million new housing units, or approximately 41,000 to 72,000 units annually over a 20-year period.
The addition of new developable land and housing supply would have significant implications for land values, construction costs, and housing prices. Assuming the land is sold evenly over a 10-year period, we estimate land prices would decline by 1.59% to 1.72% in the first year – based on empirical estimates of land supply and demand elasticities. Given that land comprises roughly 13.7% of total residential construction costs, this price reduction translates to a 0.22%-0.24% drop in construction costs in year one. Over the full decade, new home construction costs would fall by 1.9%-2.1%, all other factors being equal.
Simulating a housing supply increase of 41,000 to 72,000 units per year – representing $18-$31 billion in new capital investment annually – yields a 1.7%-2.9% decline in housing prices by year five, all else equal and relative to baseline expected home price growth.
Over the full 20-year horizon, home prices are estimated to fall by nearly 10% under the “high”, 10-mile scenario – equivalent to a $50,000 reduction based on current average home prices.
While these estimates are substantial, they reflect only static and direct impacts. To capture the broader dynamic effects on Arizona’s economy, we modeled both scenarios using the Regional Economic Models Inc. (REMI) TaxPI+ platform. This tool allowed us to assess the impacts on gross domestic product (GDP), personal income, employment, and other key metrics of expected new capital investment and economic development.
FIGURE 11
When accounting for dynamic effects, the sale and development of state trust land is projected to increase Arizona’s GDP by 8.7% by year 10 for the “high” scenario relative to the baseline and 6.1% in the “low” scenario. Given that nominal GDP growth in Arizona has averaged 4.8% annually since 2006,
this number is equivalent to nearly two additional years of economic expansion over the decade, or a 20% boost.
Unlocking Greater Value for Trust Beneficiaries
|
Historical Performance 1998-2024
Land Trust Average Annual Growth: 3.7%
Average Annual Distribution: $54.7M
PLETF Average Annual Returns: 7.2%
Average Annual Distribution: $144.7M
|
In addition to development impacts, reallocating the state’s trust assets away from physical land – which have proven costly and difficult to efficiently manage on behalf of beneficiaries – and into permanent funds consisting of independently managed financial assets will benefit public schools and other beneficiaries. On average and over the long run, a balanced portfolio like the PLETF can expect to earn between 7% and 8% annually on average. Accounting for compounding interest as well, that means the value of such a portfolio before distributions should double approximately every decade – in turn allowing distributions to beneficiaries to double over roughly the same period. For perspective, based on a historical review of the PLETF’s market value and assuming a constant distribution of 2.5% of five-year average market value of the fund, distributions to beneficiaries would have doubled between 1998 and 2008, and again between 2008 and 2015.
These numbers is not mere speculation. We know the historical relative performance of the Land Trust and PLETF in Arizona, and we also know the experience other organizations have had after they leveraged by managing large financial endowments responsibly and over time. Harvard University famously manages a permanent fund worth more than $50 billion for the benefit of the institution. The fund earns an average annual return of about 11% and distributes about $2 billion to the various schools and programs Harvard operates. How did it begin? With a humble seed grant of just $400 dollars in the 17th century[xliii] – worth the equivalent of about $200,000 today. Even at the beginning of the 20th century, it was worth only about $25 million – but the introduction of modern, diversified investment management strategies over time led to rapid and permanent growth.
Historical Counterfactual
Using historical lease-use and land area data from ASLD, along with actual historical permanent distributions derived from the lands, CSI estimated the value of the original 1912 land grant to Arizona. Subject to inflation and a best-use adjustment, which accounts for shifting land use over time as well as the cost of money, we treated land as a perpetuity: a fixed asset with defined and immutable physical characteristics. On the other hand, the PLETF is a permanent fund composed of mixed financial assets; it can create (or lose) value. A reasonable assumption, though, is that a mixed risk-balanced portfolio might typically realize returns consistent with a basket divided between the Dow Jones Industrial Average (DJIA) and U.S. Treasury bonds. Actual historical returns from such a portfolio are, in hindsight, easily known.
Given these facts, CSI constructed a counterfactual scenario for the common schools’ portion of the statehood federal land grant to answer the question: what if the state had rapidly, and at prevailing market prices plausible at the time, sold its original land grant and converted the proceeds into permanent funds invested in a diversified basket of financial securities? Would it have created more or less value for beneficiaries – and more or fewer distributions – than the state’s actual conduct over the past century?
As a baseline, we considered a scenario where all land in the Land Trust was disposed of over a 20-year period, deposited into the PLETF, and grown according to a weighted average of the returns on 10-year Treasuries and the DJIA less distributions to beneficiaries. We noted that while the weighted investment growth considered for the counterfactual scenario differs from the growth experienced in the actual PLETF over time, it approximates more recent policy changes, namely the passage of Proposition 102 which allowed for up to 60% investment in securities.
Furthermore, we made a simplifying assumption that distributions from the PLETF in both the historical and counterfactual equal 2.5% of the five-year average market value of the PLETF. While actual historical distributions differed from this methodology, this assumption is useful for two reasons. First, it does not require complicated formulaic calculations for beneficiary distributions, which would have been dependent on metrics for which there is limited data going back to statehood. Second, this methodology matches the modern distribution framework both before and after the expiration of Proposition 123. To the extent that this simplifying assumption over/underestimated the annual distributions to beneficiaries, it did so for both our historical and counterfactual scenarios and thus did not impact the relative performance of the two scenarios.
Under these assumptions, had the state sold its land grant over a 10-year period between 1913 and 1923, it would have realized approximately $302 million in seed proceeds to establish an early PLETF. At an average annual rate of return of 9.4% over the past century (based on actual observed asset performance), this fund would today be worth more than $163 billion – compared to an estimated $19 billion in combined actual value currently enjoyed by the Land Trust and PLETF on behalf of beneficiaries and given the state’s actual historical behavior. Over that period, distributions to K-12 beneficiaries would have been worth a combined $139.9 billion in the counterfactual scenario, versus $5.8 billion in estimated historical distributions and expendable revenues accounted for in our research – a 2,312% gain to K-12 beneficiaries over the lifetime of the state.
FIGURE 12
Prospective Counterfactual
While our historical counterfactual informs us what could have happened had the Land Trust been managed through more growth-centered policies, it also is a valuable exercise to evaluate the likely outcome of these policy changes going forward. Like our historical counterfactual, we constructed a prospective counterfactual that examined what the state could expect to see in terms of Land Trust value, PLETF growth, and distributions to beneficiaries in both a status-quo scenario, and one in which the state entirely converts trust land to PLETF investments through sales over 10 years.
For this scenario we keep many of the same underlying assumptions as the historical counterfactual. We assumed average annual investment returns to the PLETF of 9.07%, aligning with the 30-year average performance of an investment fund comprised of 60% equity securities (measured through the DJIA) and 40% Treasury bonds. PLETF distributions in both our status quo and counterfactual assumed the same 2.5% distribution formula in effect following the expiration of Proposition 123. We also assumed in the status quo that some land continued to be sold each year with the proceeds deposited into the PLETF, and that the value of this land aligned with the historical trend. For example, land sales over the last 10 years brought in an average of $221 million annually for the PLETF; we contemplated an average annual revenue into the PLETF under our status quo of $248 million.
The sale of all the land in Trust yields $15.3 billion over 10-years for the PLETF, which, along with investment growth, increased the prospective counterfactual PLETF from $8.1 billion in 2024 to $37.0 billion by 2034.
By 2075, the prospective counterfactual PLETF would increase to $544.1 billion, a growth of 2,771% over the combined value of the Land Trust and PLETF in 2024. More than $169 would be distributed to beneficiaries over this time. In comparison, the combined value of the Land Trust and the PLETF under the status-quo case would increase to $384.3 billion, a 1,928% increase. Over this time, the cumulative distribution to beneficiaries from both the Land Trust and the PLETF would reach $104 billion, nearly 40% less than under our prospective counterfactual. For context, the additional $65 billion in distributions between our prospective counterfactual and status quo scenario alone is enough to completely fund all K-12 expenditures in the state – including all local, state, and federal funding – for nearly 4 years.
Alternatively, according to educationdata.org, Arizona ranks 49th in per-pupil funding (at, by their accounting, $10,090). Assuming no other changes in relative ranking, and that all of the additional distributions generated by this policy reform were treated as net-new K-12 funding (rather than offsetting existing equalization formula commitments from other funds), the state would move to 39th (over $20,282 per-student-per-year in 2024-25 equivalent funding). Because of the compounding effects of this kind of reform, time matters. The sooner the state makes the needed federal, state constitutional, and administrative changes needed to implement reform, the faster it can achieve the benefits contemplated by this report.
FIGURE 13
BottomLine
Arizona’s state trust lands were meant to fund public education, yet more than a century later, more than 8 million acres remain underused and generate only about $8 per acre per year – a fraction of their potential. If Arizona had more efficiently sold and reinvested those lands after statehood, the Permanent Land Endowment Trust Fund could be worth nearly $164 billion today, delivering dramatically higher returns for K-12 schools.
Reforms that convert idle trust land into productive investment could unlock billions in new value for classrooms and the economy alike. Selling and reinvesting high-value parcels near growing communities could increase the endowment to $37 billion within a decade and generate $5 billion annually in new revenue while expanding housing supply, lowering homeownership costs, and growing the state’s economy. The lesson is clear: the longer Arizona waits to modernize trust land management, the more opportunity it leaves on the table for its schools and its future.
Appendix A: Land Grants and Their Current Status, by State
FIGURE 14
Appendix B: Technical and Modeling Assumptions
Central to the analysis presented in this report is the question: what is Arizona’s land actually worth? Unlike the PLETF, the market value of which is publicly reported, the value of the land held in trust is harder to pin down.
While no comprehensive public valuation of trust land exists, annual lease revenue offers a starting point. Using a standard income capitalization-with-growth model, CSI generated reasonable estimates of land values based on current leasing activity. We completed this calculation for 2024 based on ASLD leasing data and derived the value of prior years by discounting this value by our assumed growth rate – which matched average inflation over the century.
FIGURE 15
Specifically, the value of land type j is:
Where Ij is the annual, per-acre lease revenues for land type j as reported by ASLD; R is the assumed discount rate of 7.0% based on the valuation of similar assets; and G is the constant annual income growth, assumed to match average inflation of 3.1% over the century. Figure 15 provides these valuations by land use type.
Rather than treating all trust land as equal, this approach valued each parcel based on its current use, aligning more closely with the “highest and best use” principle. It recognized that certain parcels have greater economic potential due to their location, geography, or other characteristics. The framework also allowed land values to evolve over time, not only with inflation, but as land use changes. For example, a parcel leased for grazing in 1998 would have been valued according to the revenues typical of that use. If urban expansion later led the parcel to be leased for commercial purposes, its valuation would reflect both the higher lease revenues reported by ASLD andthe annual growth rate of 3.1%. This method is both computationally efficient and conceptually realistic, capturing how once-remote rural land can gain value as urban areas expand.
The result is a more dynamic and accurate representation of the Trust’s land value over time.
Although reasonable in theory, historical land sales data indicate that estimates based solely on annual lease revenues substantially undervalue the land held in trust – reinforcing the notion that the value potential in the Land Trust has not been maximized by holding the majority of physical land. In 2024, for example, ASLD auctioned 4,025 acres of trust land, generating $655.9 million in revenue ($162,965 per acre). While this acreage represented only 0.044% of the total Trust holdings that year, the dollar value equaled 52.79% of our estimated $1.24 billion total Trust land value under the model described above.
It is logical that only the most valuable parcels are sold first, meaning that for any given sale its share of overall Land Trust value will naturally exceed the share of acreage sold. However, the size of this discrepancy (0.044% vs. 52.79%) suggests our initial estimates significantly underestimate the true value of the Land Trust.
FIGURE 16
To address this issue, we applied a simple valuation multiplier to our original land values, aligning the per-acre valuation of commercial land – the highest-valued category in our model – with the minimum per-acre sales price from auctions between 2016 and 2024. Auction data show that a multiplier of 10 brings our commercial valuations in line with average per-acre revenues in 2016 and 2019, the two years with the
lowest average per-acre sales amounts (
Figure 16).
It should be noted that these estimates are conservative. Even with a 10x multiplier on estimated land values, our valuation framework yielded an average per-acre value for all land held in the Trust (all use types) of $1,354 in 2024. This number is a reflection of the large quantity of grazing lands held in trust – land which commands very low lease revenues and therefore is valued very low – but in our estimation provides for a better approximation of the Land Trust’s value.