The 2025 Arizona “Job Killers” report, a collaboration between CSI Arizona and the Arizona Chamber Foundation, underscores Arizona’s choice: do we elect growth, or stagnate? After a decade of robust progress, the state faces a slowdown, with job growth turning negative in May and June 2025 - the first such declines since the pandemic. The State of Arizona has limited homebuilding in parts of suburban Maricopa County, some Scottsdale residents tried to stop new affordable housing construction, and Tucson’s council turned down the opportunity for new high-tech investment. This report examines the critical role of state-level policy in sustaining Arizona’s economic momentum, contrasting its trajectory with peers like Colorado and California, and highlighting the risks posed by proposed legislation and policies that could stifle growth.
This report emphasizes that deliberate, pro-growth policies are essential for Arizona to maintain its economic edge and avoid the pitfalls seen in states like Colorado.
As CSI Arizona and its partners at the Arizona Chamber Foundation embark on their third annual “job killers” report, we find Arizona at a crossroads.
But policy still matters, and the states story since the Great Recession – and particularly since the pandemic – remains illustrative.
Prior to 2019, Arizona and Colorado were on very similar growth trajectories. Besides being regional neighbors, the two states in 1990 were peers in terms of population, economy, and political environment. That close relationship would persist for more than two decades. In 1990, Arizona had 3.7 million residents; Colorado was 10% smaller. By 2015 Arizona’s population had increased 86%; Colorado by a slower but comparable 65%. Between 1990 and 2015 Colorado’s labor market would expand at an average rate of 2.1%/year, versus 2.4%/year in neighboring Arizona.
Similarly, Gross Domestic Product in the two states has historically been similar. During the 2000s, Colorado grew faster than Arizona in terms of GDP, despite fewer people. The combined trials of the Great Recession (which was particularly hard on Arizona) and the American fracking revolution and commodity price surge (particularly valuable to Colorado with its rich supply of oil and gas) fueled Colorado’s growth advantage relative to Arizona during and after the Great Recession. Between 2000 and 2015, Colorado’s real Gross Domestic Product grew at an average rate of 1.9%/year versus just 0.7%/year in Arizona.
After 2015, though, something remarkable happens here and Arizona’s growth outlook shifts dramatically. Average annual output nearly quintuples to 3.2%/year, and since 2019, Arizona’s economy has grown faster than Colorado’s (3.4% and 2.8%, respectively). Over the past five years, cumulative real GDP growth in Arizona has been 30% larger in Arizona than in Colorado.
Figure 2
CSI has a long history in Colorado. And more recently, its lens has expanded to include first Arizona, and then Iowa and Oregon. But it's important to note that this is not an isolated phenomenon. In general, between 2017 and 2022, job and GDP growth in the United States accelerated, but the trend has been uneven. Like the gradual decline of the Rust Belt before, the recent period has been marked by significant disparities, but unlike then, these are less clearly regional but certainly policy related.
In fact, the five states that have grown the fastest since 2017 – Idaho, Utah, Florida, Texas, and Arizona – all share a common pro-growth local policy agenda: lower taxes; smaller government; and reduced regulatory burden . Seventy percent of all economic growth in the United States since 2017 occurred in just 15 states, and controlling for the size of their economies, only 19 states grew faster than they would have been expected to grow given their positions seven years ago. For example, though it was 14% of the entire U.S. economy in 2017, California captured just 13% of all U.S. economic growth since; Texas was 8.5% of the U.S. economy but has captured 12% of all growth.
Arizona, for its part, has captured about 2.8% of US growth over this period, despite being less than 2% of the US economy a decade ago.
Arizona’s aggressive pursuit of economic growth and adoption of deliberate pro-business policies has moved it quickly from a relatively poor state to one that is above-average in terms of the size of its economy and the income of its households. This transition hasn’t been painless; rapid growth and development have made the local housing market one of the hottest in the country. At their peak, prices in the greater Phoenix area were increasing faster than anywhere else in the country. But overall, the results are clear: while federal policy unlocks the opportunity for growth, states must actively capture that growth by making wise policy choices.
Figure 3
Other states are learning these lessons. After lagging the nation and more competitive states for cumulative economic growth for most of the last decade, Virginia has more recently been aggressive in repositioning itself as business- and growth-friendly. For example, Virginia decoupled from California’s vehicle emissions standards at the end of 2024, which would have effectively required all new car sales to be zero-emission (or electric) by 2035. Though it is too soon to say unequivocally that the state has shifted to a higher-growth trajectory, some early evidence of success is emerging: manufacturing job growth has roughly doubled recently relative to pre-pandemic trends, and new business formation is up 50%. Both are promising indicators.
Colorado, on the other hand, continues to move backwards. Last year, CSI identified 22 ‘job killing’ bills that have been enacted in Colorado since 2019 - up from 16 just a few years ago. During its 2024 and 2025 legislative sessions, Colorado only added to this list - it opted to further regulate both its nascent AI and datacenter market, and smaller, short-term health insurance plans intended to be low cost and temporary options; it has also imposed numerous new restrictions on its labor market. Colorado also enacted its “Railroad Safety Act”, which imposed various new requirements on its railroad transportation sector. These new requirements have real economic consequences, not just for Colorado but regionally as well. About a third of all commercial cargo in the United States is transported by rail, and for some heavier commodities the shares are even larger (three-fourths of all new cars and trucks are moved by rail, as is 70% of coal). The decision to impose these new requirements was made despite an over 40% reduction in the railroad accident rate since 2000, according to the American Association of Railroads.
Figure 4
The changing fortunes of Colorado’s natural resources sector remain a striking lesson for policymakers elsewhere. Like the manufacturing sector in California, there are natural and structural advantages Colorado enjoys in the petroleum and mining space. But too much policy abuse can poison even the most productive well. Since 2019 and its adoption of strict oil and gas industry regulation, job growth in Colorado’s natural resources sector has slowed by more than 160% compared to the five years prior.
Figure 5
Migration trends follow state policy trends. Since 2019, Arizona has attracted over five times as many annual domestic migrants as Colorado on average.
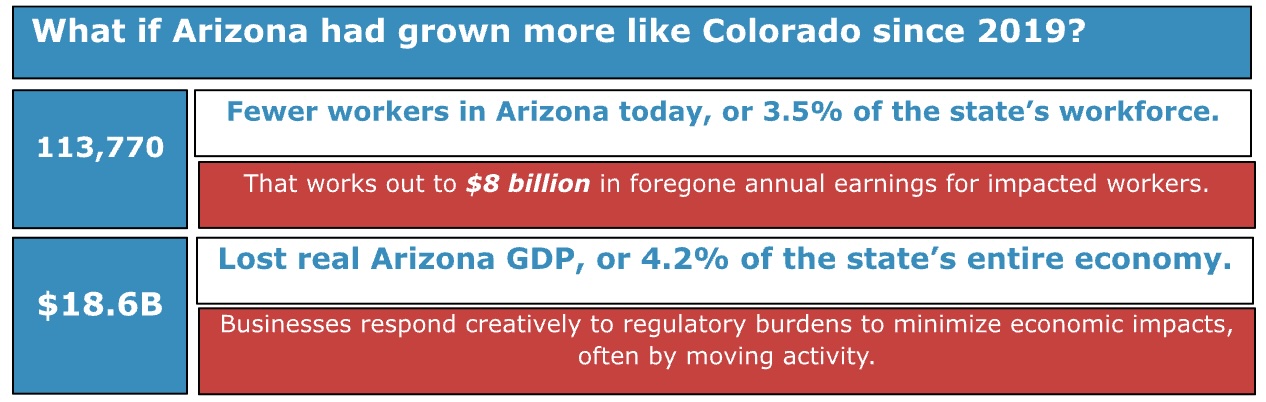
Despite the 2020 pandemic, global economic disruption, and slowing U.S. economic growth since 2022, Arizona has continued to enjoy strong economic growth during the 2020’s – building on the inertia developed during the 2010’s. The examples of Colorado, California, and other states are indicative of the importance of policy on these trends. Had Arizona gone in another policy direction more comparable to that of neighboring peer Colorado, and its growth over the past five years mirrored Colorado’s, CSI estimates that Arizona would be considerably less economically competitive:
The 2025 Arizona ‘Job Killers’ List
In partnership with the Arizona Chamber Foundation, CSI Arizona identified 85 bills introduced during the 2025 Arizona regular legislative session that were either substantial tax increases, labor cost increases, new legal and administrative burdens, or other new fees and operating restrictions for Arizona businesses. Ultimately none of the bills on this list were enacted. However, the introduction and consideration of this and similar legislation is an annual exercise, and the trend (to consideration and passage from non-consideration) can change quickly. For example, before 2019 and as far as CSI has identified, Colorado had not enacted any of these bills, either. In just six years, though, the state managed to pass dozens. Every year, more are introduced, and it is now normal for at least a couple major new regulatory acts to be enacted every legislative session in Colorado. To implement these legislative mandates, Colorado’s rulemaking agencies have created more than 14,000 new rules and administrative procedures in just the past half decade.
An initial econometric analysis using CSI’s REMI simulation software suggests enactment of the 88 bills identified and tracked by the Arizona Chamber would have imposed at least $45.9 billion in new annual costs on Arizona. These new costs could reduce Arizona employment by 660,000 jobs (-20%); reduce real per-capita personal income by up to $4,600/year (-7%); and reduce real state Gross Domestic Product by $64 billion (-15%). Note, this analysis assumes sudden and simultaneous enactment of every possible new severe rule and regulation introduced which is arguably implausible. But enacting just a few of the introduced proposals could have dramatic results for the state’s short- and long-run growth prospects. To reiterate: since 2019, Colorado has enacted only about a half dozen or so “job killing” bills during each legislative session, but the dramatic and ongoing change in its economic trajectory relative to Arizona is worth approximately 3.5% of this state’s workforce (nearly 115,000 jobs) and 4.2% of the state’s entire economy ($19 billion in real annual Gross Domestic Product).
Tax Increases
There were seven bills introduced during the 2025 legislative session that would have created new or significantly increased existing taxes on individuals and businesses. CSI estimates the total tax increase would have been more than $3.7 billion.
Interestingly, the volume of potential tax increases introduced this year was much fewer – both in number and scope – than previously. This may speak to the political rather than substantive policy-related sensitivity of legislation like this, which is often introduced in response to trends of the moment than an underlying need to fix a clear and ongoing policy problem. Last year, topics like wealth taxes and rolling back the flat income tax were popular in the commentariat; today they’ve faded behind other more current issues, and the success of tax reform is harder to argue with.
Substantive tax increases introduced this year included:
Increased sales and income taxes on financial transactions
$3.4 billion
Current law subjects corporate income to a 4.9% tax rate, and exempts the sales of stocks, bonds, and warranty contracts from TPT. HB 2592 would have increased the income tax rate to 5.5% and ended those sales tax exemptions. The bill as written was overbroad and likely unimplementable, but for this analysis we assume the sales taxes would apply only to final sales in Arizona, and on the capital gain – not the face value of the instrument.
Elimination of single sales factor for corporate income
$282.4 million
Because corporations generally don’t limit operations to a single state, they are required to use relatively complex formulas to assign income to different states for the purpose of paying tax. Those assignments impact business and investment decisions, especially if they increase liability when a company expands productive operations. To reduce investment disincentives, three-fourths of states with a Corporate Income Tax overweight or single-weight the sales factor. HB2850 would have rolled back Arizona’s single-weight sales factor formula, reducing tax incentives to invest here.
$1,000 minimum Corporate Income Tax
$39 million
Generally, taxpayers only pay a tax when they realize sales or income from a taxable activity – there are few if any poll or head taxes in the modern United States. However, Corporate Income Taxpayers are required to make a $50 minimum payment if their liability would be less (or zero). HB2840 increases that minimum tax to $1,000 – creating substantial tax liability even if the business is not generating any significant income.
1% payroll tax on most employers
$48.4 million
Previously, Arizona had a “job training tax” – a 0.1% payroll surcharge to fund certain adult education programs for employee training. It was repealed in 2017. HB2751 would have established a new tax, but on 1% of payrolls on all companies employing at least 50 people. Payroll taxes are highly distortionary – they discourage employers from increasing payroll compensation, especially in the taxed jurisdiction. This means fewer jobs, and lower pay. There are more efficient ways to finance adult education; if the employee training is valuable, it can be provided privately (often by the employer directly).
Additional bills with components that increase state taxes and fees are identified in the full table of ‘job killers’ that accompanies this report.
Labor Cost Increases
There were 16 bills introduced during the 2025 legislative session and identified by the Arizona Chamber as imposing new costs or mandates on how employers and employees interact. CSI estimates the total economic cost of these new labor regulations would exceed $30 billion.
While many of these bills would have imposed potentially small or indeterminate new costs on employers, four have the potential to be particularly destructive to the Arizona economy, including the return of a particularly dangerous change: repeal of right-to-work, which has been Arizona law since 1947 and protects the rights of both employers and employees when it comes to union relationships.
Bills considered and rejected by the Arizona Legislature this year would pre-empt negotiation over broad swaths of the employer-employee relationship, including work schedules, wage and salary negotiations, the relationship between franchisers and franchisees, and more. If enacted, evidence from other neighboring states (California, Colorado, New Mexico, and others) tells us these requirements could dramatically slow employment and productivity growth in Arizona. CSI Colorado has identified over a dozen new employment-related regulatory policy changes created since 2019. And last year, Michigan became the first state in six decades to repeal its right-to-work law, a reminder that, like with the modern return of rent control rules, without constant reminder we risk forgetting the lessons of history and repeating past mistakes. These regulations can be particularly insidious because they privatize the costs of public regulation, often hiding the consequences from the public and policymakers.
Substantive labor cost increases introduced this year included:
Repeal of Right-to-Work
$18.6 billion
HB2501 would have repealed Arizona’s 70-year-old right-to-work law, which gives workers the freedom to choose whether to join a labor organization at their new employer. In states without such protections, labor unions can require employers to operate “closed shops” where the employer agrees to hire only union members. A 2021 Harvard study notes “states with Right-To-Work (RTW) laws have experienced higher employment and population growth than states without such laws”. CSI assumes – based on this and other similar research – that repeal of right-to-work in Arizona would after 10 years reduce the manufacturing share of employment by 3.2%; reduce overall employment by 1.6%; and reduce economic migration by 0.11%. Using the REMI simulation software, CSI estimates HB2501 would have reduced Arizona’s employment by 3.9% and real Gross Domestic Product by 4.0% in 2033 (relative to its baseline). By imposing between $15 and $18 billion in new costs on Arizona businesses, the repeal of right-to-work is estimated to have the single largest negative economic impact of any of the proposals specifically quantified by CSI.
Minimum Wage Increases
$3.4-$14.5 billion
Arizona already has one of the highest minimum wages in the country – at $14.35/hour, it is the 11th highest statewide minimum and more than double the federal minimum. The current minimum wage is voter-protected and has been raised repeatedly at the ballot box over several years. It is also already indexed to the Consumer Price Index and therefore rises annually and automatically to keep pace with cost of living. There is broad consensus among academic economists that the minimum wage reduces employment and productivity growth, and harms long-run economic growth. Though it may benefit minimum-wage earners who remain employed, it results in fewer workers overall, and fewer hours for those that remain.
This year, in addition to a proposal raising the minimum way to $18/hour (HB2289), Rep. Lorena Austin got unusually creative – proposing to retroactively increase the minimum to $20/hour as of 2020 (HB2899). It’s unclear how this was intended to work if enacted, but this analysis assumes the wage would apply proactively but at an inflation-adjusted rate as though it were $20 in 2020.
Scheduling, Break, and Overtime Standards
$1.5 billion
HB2502 would tighten already-existing federal and state rules that regulate employee schedules and overtime pay. Among other things, it would require employers to provide unpaid meal breaks even though employees may, for example, prefer to work through their mealtimes in exchange for shorter work days or higher compensation. Rigid statutory rules make it harder for employees and employers to negotiate mutually beneficial agreements that rule makers often fail to anticipate. This rigidity and efficiency loss imposes economic costs that should be considered before policies like this are enacted.
Heat illness prevention
$1.2 billion
Arizona’s Industrial Commission and the federal Occupational Safety and Health Administration regulate workplace safety, including in part by requiring employers be aware of the potential for heat-related illness. OSHA establishes general guidelines, and Arizona provides specific guidance via its Heat Illness Prevention Program.
HB2790 goes beyond these existing standards with a top-down mandate of unclear value: it establishes an annual heat training program requirement, and adds new supervisory and compliance mandates. Although HB2790 would almost certainly increase labor litigation, it’s unclear how much benefit it would provide employees.
Additional bills with components that increase labor and hiring costs are identified in the full table of ‘job killers’ that accompanies this report.
Energy and Environmental Cost Increases
Of the 85 bills tracked by the Arizona Chamber, CSI identified 16 that would impose new energy and environmental regulations. CSI estimates the total economic cost of these new environmental regulations would exceed $8 billion.
Environmental rules are already a significant regulatory burden on American industry. In aggregate, it is estimated that nearly 2% of Gross Domestic Product is spent on compliance with existing state and federal environmental protection regulations. A meta-analysis of 12 Colorado statewide energy and environment policies enacted or considered since 2019 identified approximately $1 billion in new annual compliance costs for that state’s businesses, and Colorado has created at least 55 new energy and environmental regulatory policies since 2019. More recently, Arizona has regulated the construction of suburban housing in a poorly-conceived but well-intentioned move to conserve water – exacerbating the states ongoing housing affordability crisis and, ironically, potentially leading to more net water use. As always, policymakers must be cognizant of the potential for unintended consequences from regulation.
Adoption of California vehicle emissions standards in Arizona
$3.5B
By law, regulators in Arizona cannot prohibit the sale or purchase of vehicles based on their fuel type. HB2252 would repeal this consumer protection, and surrender Arizona’s emissions control policies to California. California has adopted emissions policies that are the most restrictive in the country and are on track to effectively require all new vehicles sold in that state be electric or “zero-emission”. This analysis assumes adoption of these standards here would ultimately increase the average new vehicle sales price by $9,000 per car.
50% renewable electricity generation mandate
$2.2B
SB1389 would require Arizona’s electric distribution utilities to generate at least 50% of their electricity from “renewable energy sources” by 2035. While proponents often claim that wind and solar are cheaper sources of electricity than conventional alternatives, these analyses ignore the intermittency inherent to this technology. After accounting for the additional costs required to account for this intermittency (both by building more base generating capacity, and by building redundant backup capacity in the form of either batteries or fast-cycle natural gas), a mandate like SB1389’s would likely increase electricity costs by 44% - directly costing the state 14,000 jobs, $1.1 billion in lost personal income, and a permanently reduced economic competitiveness position.
Additional bills with components that increase energy and environmental costs are identified in the full table of ‘job killers’ that accompanies this report.
Legal & Administrative Cost Increases
CSI and the Arizona Chamber identified 55 of the ‘job killing’ bills as imposing new legal and administrative compliance burdens on Arizona businesses. CSI estimates the total economic cost of these new general administrative regulations would exceed $3.8 billion.
A perennial favorite for regulators and policymakers, this year we saw particular interest in imposing new rules and regulations on the state's housing and rental markets. Though well-intended as a way to address high shelter costs, which have risen faster in the Phoenix area than anywhere else in the country, we know policies that limit the ability of the market to respond to rising housing demand can destroy cities over time.
Rent Control
Up to $28 billion
HB2707 repeals statute pre-empting local jurisdictions from imposing rent control on their housing markets. Largely disappearing from state and local policymaking after being discredited in the 1970s, rent control policies have enjoyed a recent resurgence. However, there is broad and well-documented economic consensus that these policies are especially destructive to affected rental markets and tend to reduce both the quality and supply of available housing. Famously, Harvard economist Greg Mankiw called rent control “the best way to destroy a city, other than bombing”. Though HB2707 on its own doesn’t impose this self-destructive regimen, it does allow for it. Our impact analysis applies this existing research to the Arizona rental market to estimate the maximum potential economic losses such a policy might impose on the states housing market, if it were widely adopted.
Mandatory “Cash Pay”
$866 million
HB2683 would have required Arizona retailers with at least one “physical location” to accept cash for payment on transactions of less than $100. The introduction of this bill in Arizona follows a national trend of states considering and enacting mandatory cash payment options (including Colorado in 2021). However, these well-intentioned mandates often fail to consider the tradeoffs inherent in a business’s decision to accept or refuse any form of payment, particularly on the margin.
Accepting cash is not costless. A business must purchase cash counting and storing equipment; hire staff to transport the staff from the business to its bank for deposit; account for losses due to accidental or deliberate mishandling; and account for the cost of the additional time required to process cash transactions. According to one industry study, administrative costs of accepting cash range from 4.7% to 15.3% per transaction, depending on the size and efficiency of the business’s cash operation. For context, credit card processing fees typically range from 1% to 3%, and cashless pay options (like Square) typically charge fees in the 3.5% range.
Further, recall these are average costs. At the margin, costs can be much higher. A business traditionally set up to handle only cash transactions could have very high marginal costs associated with beginning to accept a small number of relatively low-dollar credit card transactions. Conversely, a business handling only cashless payments newly required to accept cash faces thousands of dollars in startup and ongoing costs to process (potentially) very few net new cash transactions – it must purchase new equipment, devote time to staff training and security and compliance, and develop new account relationships with its financial partners. Policymakers should consider that no business decision is made in a vacuum and no successful business deliberately excludes a potential customer.
Price gouging prohibition
$125.3 million
A now annual exercise in Arizona, state-funded and mandated leave programs have been popular in recent years. Seventeen states, including Colorado, have enacted these kinds of programs. Various studies have linked the programs and the taxes that fund them to increased costs of doing business and reduced economic output. For example, a 2019 study by CSI Colorado estimated the cost of that state's new mandatory family leave program at $1.3 billion annually.
Restrictions on Pharmacy Benefits Managers
$290 million+
The American healthcare and insurance system is highly complex, highly regulated, and very expensive. The process is often frustratingly opaque for patients, due to the involvement of various intermediaries between them and their healthcare providers. A pharmacy benefit manager is such an intermediary, who negotiates pharmaceutical benefit reimbursement rates on behalf of insurers and other payers – and because of this status, they make an easy villain. However, their role is important; the pharmacy has little incentive to negotiate lower drug costs, and patients rely on their insurance company or benefit plan to pay those costs on their behalf.
HB2208 – though well-intentioned – would increase benefit costs and also reduce incentives to seek to lower drug and pharmaceutical prices. Not only would this bill likely increase insurance costs directly (by an estimated $290 million statewide), but also ultimately contribute to higher rates of healthcare inflation generally. And the primary beneficiaries would be not patients, but pharmacies. Similarly, SB1102 limits the types of coverage these managers can offer, and how they can update their contract terms. By removing or limiting incentives by payers and providers to limit costs, these kinds of policies can inadvertently raise prices, or pick winners and losers.
New efficiency requirements for plumbing fixtures
$110.7 million
HB2253 would require new plumbing fixtures sold or installed in the state to meet a specific, high-efficiency requirement that exceeds current state and minimum standards. In addition to reducing the effectiveness of the appliance itself, these new fixtures are generally significantly more expensive than other options. The net effect of this kind of mandate is higher costs to consumers for new plumbing work; less effective plumbing appliances; and shorter useful appliance lives leading to more frequent repairs and replacements.
These high-efficiency reforms are generally sold as being net-savings for consumers, considering the reduced water use of the new fixture. But for that to work, numerous assumptions must hold: the appliance must last years without repair or replacement, and the user must not make other changes to compensate for reduced water flow (like taking longer showers). At this point, the easiest efficiency improvements have already been made, and further gains often come at high cost. This kind of accounting is best made by consumers and producers in the marketplace, based on individual preferences, cost, and technical ability.
Additional bills with components that increase administrative and legal costs are identified in the full table of ‘job killers’ that accompanies this report.
Workforce & Education Cost Increases
CSI and the Arizona Chamber identified 1 of the ‘job killing’ bills as imposing new education and workforce training costs on Arizona businesses, in addition to one primarily tax-related bill that also has a significant workforce training component. CSI estimates the total economic cost of these new education mandates would exceed $45.7 million.
Tuition Surcharge for Financial Aid
$45.7 million
HB2752 would have required the Arizona Board of Regents (ABOR) to assess a $300 annual tuition surcharge on all non-resident students at the state’s public universities, to subsidize qualifying in-state students’ tuition.
ABOR and the regulated public universities already enjoy considerable authority both in setting tuition and offering financial aid. Depending on market conditions, the universities already set their tuition for out-of-state students considerably higher than for similar in-state students, and that differential is used to support various university operations – including financial aid. On average, in fact, CSI estimates that non-resident students are paying between two-and-a-half and three times the tuition rates of in-state students.
This mandatory surcharge would interfere with the current price-setting practices and may have unintended consequence of reducing non-resident student enrollment to the point that resource losses exceed the gains to this new fund.
The Bottom Line
Arizona stands at a crossroads. After a decade that brought generational change, job growth has stalled, and the economy has slowed. The lessons are clear: there are pro-growth policies, and policies that hurt growth. Too often, the search for villains – developers or data centers being blamed for water shortages, or investors and short-term-rentals for housing market woes – deflects from real problems and leads to harmful policies.
This year’s edition of this annual update is an important reminder of the stakes.
Appendix 1: ‘Job Killers’ Bill List


Appendix 2: ‘Job Killers’ Bill Impact Source List
Mercatus Center, Snapshots of State Regulations
Arizona Department of Revenue, Fiscal Year 2022 Annual Report, https://azdor.gov/sites/default/files/media/REPORTS_ANNUAL_2022_ASSETS_fy22_annual_report.pdf
Arizona Department of Revenue, The Revenue Impact of Arizona’s Tax Expenditures Fiscal Year 2022, https://azdor.gov/sites/default/files/media/REPORTS_EXPENDITURES_2022_fy22-preliminary-tax-expenditure-report.pdf
Arizona Department of Revenue, https://azdor.gov/sites/default/files/2023-12/REPORTS_CREDITS_2023_Arizona-Credit_History_Official-Release.pdf
Joint Legislative Budget Committee, https://www.azjlbc.gov/revenues/23taxbk.pdf
Joint Legislative Budget Committee, Fiscal Note on SB1164 2011, https://www.azleg.gov/legtext/50leg/1r/fiscal/sb1164.doc.pdf
Manhattan Institute, https://manhattan.institute/article/costs-and-benefits-of-source-of-income-discrimination-laws#notes
Journal of Public Economics, http://piketty.pse.ens.fr/fichiers/enseig/ecoineg/articl/Susin2002.pdf
Route Fifty, https://www.route-fifty.com/finance/2024/05/why-income-discrimination-laws-hurt-poor-renters/396559/
Joint Legislative Budget Committee, https://www.azleg.gov/legtext/56leg/2R/fiscal/HB2274.DOCX.pdf
Bureau of Labor Statistics, https://www.bls.gov/oes/current/oes330000.htm
American Action Forum, https://www.americanactionforum.org/research/state-level-costs-of-the-protecting-the-right-to-organize-act/
NERA Economic Consulting, https://www.nera.jp/content/nera/en/publications/archive/2018/nera-economists-comment-on-the-economic-evidence-supporting-righ.html
Society of Labor Economists, https://www.journals.uchicago.edu/doi/10.1086/719690
Arizona Commerce Authority, https://www.azcommerce.com/programs/
National Mining Association, https://nma.org/attachments/article/2372/11.13.15%20NMA_EPAs%20Clean%20Power%20Plan%20%20An%20Economic%20Impact%20Analysis.pdf
Joint Legislative Budget Committee, https://www.azleg.gov/legtext/56leg/2R/fiscal/HB2436.DOCX.pdf
Arizona State Senate Research Staff, https://www.azleg.gov/legtext/56leg/2R/summary/S.2471GOV_STRIKERMEMO_ASPASSEDCOMMITTEE.pdf
The Journalist’s Resources, https://journalistsresource.org/economics/rent-control-regulation-studies-to-know/
Bureau of Economic Analysis, https://apps.bea.gov/itable/index.html?appid=70&stepnum=40&Major_Area=3&State=0&Area=XX&TableId=600&Statistic=4&Year=2023&YearBegin=-1&Year_End=-1&Unit_Of_Measure=Levels&Rank=1&Drill=1&nRange=5
United States Census, https://www.census.gov/retail/sales.html
Plains Capital Bank, https://www.plainscapital.com/blog/the-cost-of-accepting-cash/
International Franchise Association, https://www.franchise.org/sites/default/files/2024-02/2024%20Franchising%20Economic%20Report.pdf
Alliance for Innovation and Infrastructure, https://www.aii.org/a-longer-view-on-longer-trains-part-2-costs/
Stilt, https://www.stilt.com/careers/how-much-does-uber-pay/
AAA, https://gasprices.aaa.com/state-gas-price-averages/
U.S. Department of Energy, https://tedb.ornl.gov/wp-content/uploads/2022/03/TEDB_Ed_40.pdf
Association of American Railroads, https://www.aar.org/data-center/railroads-states/
United States Department of Agriculture, https://www.nass.usda.gov/Statistics_by_State/Arizona/Publications/Annual_Statistical_Bulletin/2021/AZAnnualBulletin2021.pdf
Arizona Mining Association, https://www.nass.usda.gov/Statistics_by_State/Arizona/Publications/Annual_Statistical_Bulletin/2021/AZAnnualBulletin2021.pdf
U.S. Energy Information Administration, https://www.eia.gov/state/analysis.php?sid=AZ
Arizona State Senate Staff, https://www.azleg.gov/legtext/56leg/2R/summary/S.1479MAPS_ASPASSEDCOMMITTEE.pdf
Joint Legislative Budget Committee, https://www.azleg.gov/legtext/56leg/2R/fiscal/SB1498.DOCX.pdf
Arizona Corporation Commission, https://azcc.gov/docs/default-source/utilities-files/electric/annual-reports/arizona-public-service-company/arizona-public-service-(aps).pdf?sfvrsn=80e95bd2_3
City of Scottsdale, https://str.scottsdaleaz.gov/
Verified Market Research, Global Market Size by Type Reports
Arizona Department of Revenue,
https://azdor.gov/sites/default/files/document/PROPERTY_2024_AbstractAssessmentRoll.pdf