The Arizona Budget Then and Now
Arizona Budget: Then and Now helps contextualize the entire Arizona State Budget – over time and across all funds.
This year, the Legislature will enact and the Governor execute a budget that spends over $60 billion – including from the General Fund ($16 billion), and approximately 1,200 Other Appropriated Funds ($5 billion), but also another $42 billion in so-called Non-Appropriated Funds.
This year, the state will probably spend nearly $27 billion in Federal funds – mostly on healthcare, but in recent years Federal sources have grown across state government (for example, after the pandemic Federal funding in Arizona’s K-12 system roughly doubled to ~$800 million/year, according to JLBC).
Key Findings
Rapid revenue growth over the past ten years has enabled recent state budgets to become reckless. Spending has grown rapidly, technical rigor has lost focus, and the inflow of Federal and Non-Appropriated monies has enabled new programs and spending commitments outside of the normal budget process.
- After ten years of balanced budgets, the GF accumulated a record $4.5B surplus in FY22 – but subsequently boosted spending by 40% in just two years, exhausted the cash surplus, and lead to the first projected General Fund deficit since 2016 last year.
- The FY26 Executive Budget proposes $1.6 billion in new spending (+9.8%); 89% of the increase comes from ongoing increases; 51% comes from new Executive initiatives.
- Technically sound budgeting keeps the budget healthy over the long-run: spending growth should be moderate and sustainable, accurately accounting for a three-year outlook avoids overpromising, and supplementals should be used for unexpected new costs on existing programs – not be a tool for new policymaking.
Arizona’s General Fund correlates well with City, Town, and County General Funds - and as the General Fund has experienced record revenue growth in recent years, so have local governments. This has occurred despite tax cuts and other statewide policy changes.
- CSI estimates that Arizona cities and towns have received $7+ billion in “surplus” local and State shared revenues than what they could have expected given long-run trends. Through 2028 CSI estimates these “excess” revenues will reach $11 billion.
- Statewide, municipalities are expected to see a revenue decline of $220 million between 2024 and 2025 due to statewide tax cuts. However, as intended, the additional distribution to cities and towns through enhanced Urban Revenue Sharing (URS) payments in 2024 and 2025 far exceeds these losses.
- Local government budgets have probably grown at least 32% since 2019; implied General Fund cash reserves for all city, town and county governments combined should be approaching $6 billion.
Annual Appropriations & Spending – Where It Goes
How Much Money Does the Arizona State Government Spend?
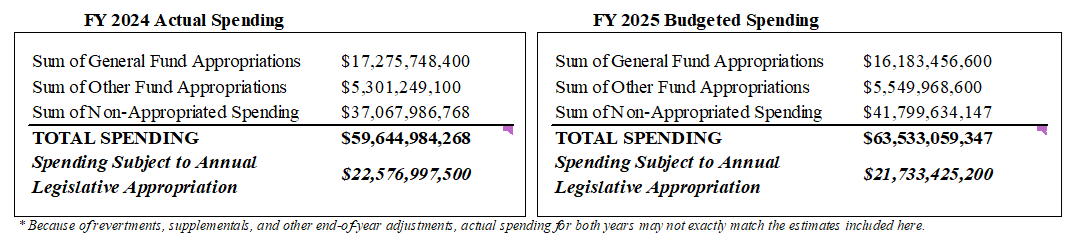
Each year, the state's legislature approves the General Appropriations Act - a single budget omnibus that dictates how most public revenue will be spent. The Legislature additionally approves dozens of individual spending and appropriations bills. While all public money generated by State taxes and fees is subject to appropriation, some funds are statutorily or continuously appropriated and not subject to the annual budget process. Federal and certain non-State monies are not subject to appropriation by the Legislature but may be subject to some statutory control.
State Government Revenues – Where It Comes From
Flow of Tax & Non-Tax Revenue from the Source to State Agencies in FY24
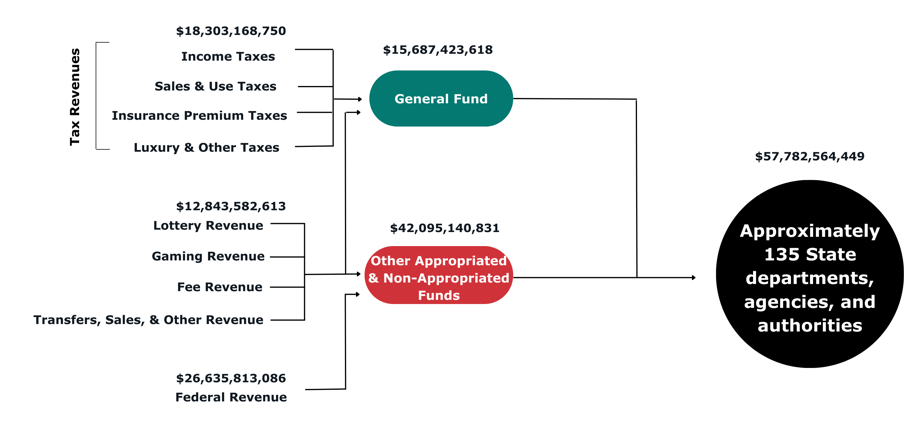
The image above displays the flow of state revenue from the tax, fee or other revenue source to the state agency that is authorized to spend the revenue. There are many different types of state agencies, and many different types of revenue, and the Legislature ultimately determines who receives what. The flow above is intended to be generally illustrative only.
Critically, we hope this illustrates that a substantial volume of annual revenue (predominantly Federal funds but also including other non-State grants, gifts, and other sources) is not well captured in the existing annual budgeting and public oversight processes, and that over time a growing majority of spending and revenue occurs outside the General Fund.
Change in Total Appropriations By Spending Area
From FY05 to the FY26 Governor's Budget Request
In terms of all funds – General Fund, appropriated and non-appropriated spending but excluding federal funds – nominal spending growth over the past decade has been concentrated in education, healthcare, and social services.
Arizona Total Spending by Fund Type in FY15 & FY25
Total appropriations and estimated non–appropriated spending in FY25 is approximately $66.3 billion, or more than double the spending levels ten years ago. Additionally, while all appropriated funds – including the General Fund – grew by 69% over this time, total non-appropriated spending – spending not subject to legislative oversight - grew by 123%.
General Fund Revenue and Spending Growth From FY16 to the FY26 Governor’s Budget Request, including Ending Cash Balance
Drastic spending increases in FY23 and FY24 – averaging over 17%/year according to the JLBC Baseline – erased $4.7 billion in cash surpluses by FY24. The rapid exhaustion of fiscal surpluses accumulated over roughly a decade necessitated over $975 million in fund transfers and ex-appropriations in the FY25 budget.
Even though lawmakers reduced spending in FY25, spending growth still averaged 7.7% per year over the past three years – nearly double the long-run average growth rate of 4.2% (2012-2022). If spending growth had instead remained at this long-run average, the cash balance today would exceed $7 billion even without the $877 million in fund transfers between FY 2024 and FY 2025.
FY 2026 Executive Budget Uses Supplemental Funding For $157M In New Initiatives
Source: FY 2016 – FY 2026 Executive Budgets
*FY 2021 & FY 2022 excludes $389M & $596M, respectively, for pandemic-related education and public safety assistance; FY 2024 excludes $350M in ex-appropriations related to the FY 2025 deficit forecast. FY 2024 amount excludes $350M in appropriation adjustments to address General Fund deficits in FY 2024 and FY 2025
Other than the FY 2022 and FY 2023 Executive proposals - which both included a single, large non-caseload supplemental issue - the FY 2025 proposed budget represents a further break from the norm by including 10 non-caseload supplemental issues totaling over $156 million in new expenditures for the State General Fund.
Overall, the FY 2025 Executive Budget proposes nearly $340 million in supplemental appropriations from the State General Fund. Of the $157M in new initiatives, $57 million alone is due to higher capitation rates at the Department of Economic Security due to the Executive’s decision to continue the Parents as Paid Caregivers program.
Omission of Out-Year Medicaid Caseload Growth Leads to General Fund Deficits in Executive Budget
The FY '26 Executive Budget fails to include caseload growth in FY '27 and FY '28 for the State's Medicaid system.
On average, the General Fund budget for the State’s Medicaid program has increased around 9% per year, and failing to budget for any increases beyond FY ‘26 would lead to a $631 million General Fund deficit by 2028 given the rest of the Executive’s spending and revenue assumptions.
IMPROVING THE BUDGET PROCESS GOING FORWARD:
Moderating spending growth, fully accounting for expected costs over the entire budget window, preserving a reasonable cash balance, and using the regular budget process to conduct policy.
Policymakers should re-learn the lessons of the decade after the Great Recession:
- Limit annual spending growth. Annual 10%+ growth rates are simply too risky even in a revenue environment where they might appear sustainable. New spending priorities should be driven by clear policy need rather than the simple availability of cash.
- Use Supplemental and Non-Appropriated Funds to fund existing commitments that are authorized and anticipated by the regular budget process. New policymaking should occur in the regular budget order.
- Fully account for the three-year budget outlook. Failure to include all reasonable cost and revenue projections over the entire three years makes it easier to overcommit to new ongoing spending or miss clear and imminent fiscal issues.
Executive Budget Proposes 9.8% Growth in Spending Above Prior Enacted Levels – and May Not Be Sustainable in the Out-Years
After facing record deficits in the State General Fund in FY 2024 and FY 2025, the FY 2026 Executive Budget proposes to grow spending by another 10% next year, with ongoing funding alone growing 9.1%. Of this increase, 51% is attributable to new executive initiatives.
The revised budget plan accounting for omitted Baseline funding costs leaves between $23M and $130M in cash reserves. Even a 1% margin on an $18 billion budget calls for a $180 million cash balance in every budget year.
Municipalities Misattribute Budget Woes to Falling Revenues
After spending down over $7 billion in “excess” State shared and local revenues, many cities and towns are now proposing tax increases to cover projected budget deficits.
- November 2024: Scottsdale voters approved a 0.15% sales tax (TPT) increase (Proposition 490)
- March 2025: Tucson proposed and voters rejected a 0.5% sales tax increase (Proposition 414)
- March 2025: Phoenix City Council approved a 0.5% sales tax
Despite claims to the contrary, Arizona cities and towns have (so far) received more State shared revenues because of the Flat-Tax legislation, not less.
Municipalities are continuing to raise taxes to sustain the rapid spending growth of the last several years (that would otherwise slow down as revenue growth normalizes), not because of any revenue shortfall or fiscal necessity.
- CSI has identified at least 15 sales tax rate increases at the local level since 2019, and the average local TPT rate has increased from about 2.72% to 2.79%
Since 2020, State Shared and City Sales Tax Revenues Have Surged, Adding Over $7 Billion In “Excess” Revenues Through FY 2025
After following a strong and stable 4.8% annual growth trajectory for nearly a decade, municipal and county revenues - both local and state shared - have surged (averaging 9.3% per-year), leading to nearly $7 Billion in cumulative revenues between 2020 and 2025 beyond what cities could have expected given prior trends. Based on revenue forecasts through 2028, the net cumulative "excess" revenues are expected to reach $11 billion, even after state-imposed revenue cuts.
Components of Municipals’ Year-Over-Year Revenue Decline
Municipalities are expected to see revenue losses of -$412 million in FY 2025 due to URS declines and lost revenues resulting from the abolishment of rental TPT. These declines are partially offset by rising State shared and local TPT revenues (+$191 million), yielding a net year-over-year revenue loss for all municipalities combined of $220 million in FY 2025.
State Shared Revenue Disbursements Exceed One-Time Year-Over-Year Losses
Source: Arizona Department of Revenue Annual Reports, JLBC FY 2024 Appropriations Report, JLBC Estimates of Rental Tax Repeal, CSI Estimates
NOTE: Net revenue loss includes the combined impacts of the 2.5% flat tax (reduced URS distributions) and rental tax repeal, net of expected natural revenue growth.
One-time increased distributions to cities and towns - $472 million - exceed by a factor of two expected year-over-year revenue declines in FY 2025. Aggregate city revenues are expected to resume growth next year, at a higher pace in part due to state policy changes (the Flat Tax & Remote Sellers Tax).
Comparing What Cities Would Have Received Without The Flat-Tax Legislation To Actuals
NOTE: Pre-Flat Tax estimates calculated using 15% URS distribution rate and a counterfactual estimate of FY 2022 and FY 2023 income tax revenues based on JLBC estimates of tax cut impacts. After-Flat Tax represents actual URS distributions.
Without the implementation of the 2.5% flat tax (and the accompanying increase to URS payments to cities and towns), municipalities would have received $260.8M less in State shared revenue last year, and only $11M more this year. Meaning, cities and towns today have received $249.4M more revenue due to the flat tax legislation.
Local Government Revenue and Spending Growth From CY11 to CY22
Based on its review of some local and statewide historical revenue and expenditure data, there is a strong correlation between the State budget, and local budgets. Therefore, it is no surprise that – like the State General Fund – local governments saw rapid revenue growth over the past 5-10 years. And unsurprisingly, local spending likely caught up to this growth in the ‘22-’24 period. That is far more likely to be driving any current local budget shortfalls than state tax policy changes.
Despite Surging Revenues, Municipalities Hiked TPT Rates 15 Times In Last Six Years
Arizona's cities and towns have increased their sales tax rates 15 times over the last six years, while also enacting or requesting around two-dozen other tax increase, including property taxes.
Fiscal Uncertainties
•Every budget and forecast is necessarily speculative and subject to risk and uncertainty – both known and unknown.
•The environment this year is a mix of known risks and uncertainties, all of which should be weighed by policymakers and incorporated into their final spending and revenue plans
•Known Risks: Temporary federal assistance to governments, non-profits, schools, and others over the past several years is coming to an end; some of that money may even be clawed back. Future federal funding is likely to be more conservative than it has been due to unsustainable federal deficits.
•Uncertainties: A federal government that tries to do less with less will have consequences, particularly in healthcare, education, and other sectors traditionally subject to significant federal oversight.
•Tariffs and other trade and economic adjustments are likely to have consequences, subject to each states particular economic mix and exposure. Arizona’s manufacturing sector may benefit, while its consumers may face higher prices and/or lower import product availability.
•By law, Congress must make spending reductions. Healthcare is our largest expenditure area, and most of it is federally funded. Federal policy changes could have local budget and/or policy implications.
Main Points / Takeaways
- Lawmakers at both the State and local level have allowed their budgets to grow rapidly over the past five years, in response to tax revenue growth. Inevitably, revenue growth will normalize, and the transition back to ”normal” budgeting may be shocking for some jurisdictions.
- Despite claims regarding the enactment of the flat income tax, through 2025 municipalities have received MORE State shared revenues compared to if the flat tax legislation – and corresponding 18% URS rate – were never enacted.
•The URS increases alone (+$472M) more than cover the anticipated year-over-year declines in local TPT and state shared revenues between 2024 and 2025 (-$220M). Considering other revenue sources which CSI does not have complete data for (local property tax revenues, other taxes and fees, etc.), municipalities may actually experience revenue growth in 2025.
- State and local budgets will continue to experience future budget issues if sound budgeting practices are not followed.
•Spending should be restrained to objective benchmarks and funding increases determined by need rather than capacity.
•Both the legislature and the Executive should avoid using the supplemental funding process for new policy initiatives, and one-time federal monies should be used for one-time purposes.
•The purpose of the three-year budget window is to maintain a sound fiscal footing over time. Policymakers at all levels should ensure their long-term projections are accurate and reasonable.