Introduction
In a recent survey of 3,800 college prospects, students were asked what motivates them to attend college. The two top responses were “Learning” and “Career.” Given the amount of public and private resources that are devoted to higher education—over $1 trillion across the U.S.—these top two reasons seem self-explanatory. Unfortunately, postsecondary education credential production does not always correlate with strong economic outcomes. As such, it is important to examine whether a state’s system of higher education truly prepares graduates for success and leadership in high-demand, high-paying jobs by offering access to credentials linked to a high return on investment (ROI) for the learner, including for first generation and underserved communities.
This study examines the effectiveness of Colorado’s outcomes-based funding formula for higher education. It also assesses how targeted adjustments — particularly to the weight assigned to credential production — could enhance workforce readiness and drive economic mobility. Using econometric analysis, we find that even modest shifts in funding incentives could lead to meaningful improvements in labor market outcomes, strengthening Colorado’s talent pipeline and long-term economic competitiveness.
More specifically, CSI’s modeling suggests that if the state centered its outcome-based funding formula to strategically include credentials of value and wage/employment outcomes, which are credentials associated with high workforce demand and a high ROI, Colorado’s institutions could set the national stage in terms of bridging workforce gaps and bolstering economic mobility.
Since 2020, Colorado has utilized a performance-based funding (PBF) model for higher education. While this structure is intended to incentivize institutional effectiveness and student success, the current model has some structural inefficiencies and generally lacks responsiveness to the evolving higher education landscape. A primary concern, for example, is that the formula disproportionately favors traditional, full-time students and does not adequately account for the complexities of Colorado’s nontraditional student population. Despite national trends showing that roughly one-third of college students enroll part-time, the state’s funding mechanism does not fully recognize the academic progression or completion rates of the part-time learners, transfer students, or adult learners even though these learners will be key to fulfilling future workforce needs, especially as the state confronts declining birth rates and shrinking K–12 pipelines.
Moreover, the model emphasizes year-over-year changes in degree completion rather than longer-term equity or workforce-aligned outcomes, such as employment.
Background on Current System
Colorado’s higher education outcome-based funding model stems from House Bill (HB) 20-1366, approved during the 2020 General Session. The legislation aimed to boost the earnings potential of future college graduates by tying funding allocations to institutional performance across eight key indicators, identified in Figure 1.
Figure 1
Funding allocations differ by institution, depending upon how well Colorado’s Institutions of Higher Education (IHE) rank based on these indicators. HB 20-1366 was a step back from an earlier framework, created by HB 14-1319, that had emphasized credentials in high-demand fields like healthcare and science, technology, engineering, and mathematics (STEM).
The HB 20-1366 formula allocates funding by using existing base funding plus or minus additional funding based on three steps that are:
Base funding: An institution’s funding allocation, less one-time funding from the prior year.
Step 1 — Allocations based upon the Colorado Commission on Higher Education priority: The Colorado Commission on Higher Education may recommend additional funding to add to the base prior to performance funding allocations for the following purposes:
- Progress toward master plan goals, including addressing base funding disparities or funding priorities not addressed through performance funding.
- Additional costs associated with educating resident first-generation undergraduates.
Step 2 — Performance funding: Following the calculation of base funding allocations and pre-performance budget adjustments, all funds are distributed through performance-based funding. This allocation is determined by each institution’s relative rate of change over time on a set of performance metrics compared to peer institutions. The state utilizes eight key inputs to assess institutional performance. These metrics are illustrated in Figure 1.
Step 3 — Temporary Adjustments: Institutions may receive temporary funding adjustments based upon legislative or other priorities, such as progress toward a master plan goal. Temporary funding adjustments do not automatically become part of the base in the following fiscal year. Since the new formula was established, the Colorado Department of Higher Education (CDHE) has yet to use temporary funding adjustments.
Key Findings
- Colorado’s current funding formula doesn’t reward better performance in any substantive way. The lack of real financial rewards provides very little incentive for higher education institutions to move the needle on credentials and other job-ready/society improving skills. As it currently stands, graduates of institutions generating wages in the economy subsidize other institutions and their graduates.
- For public institutions, the total state appropriation is of greater significance than any performance on the eight factors in the performance-based funding formula. This creates stability at the expense of rewarding performance. Thus, funding on the margin creates very little impetus for change, as the base makes up over 97% of total funding.
- Since the formula’s enactment, no institution has seen its share of total state funding increase or decrease by more than 1% - although some have seen declines in student enrollment greater than that.
- The lack of incentive is clearly shown in the following figure, which shows that institutions all generally see similar growth rates in funding each year.
Figure 2
- Funding for the Colorado State University (CSU) system grew by 44% over the past five years. Only 0.67% of that growth was due to performance funding. Virtually all of the increase was due to increased appropriations, further contributing to the above point.
- Since the implementation of the current funding formula, state appropriations for higher education have grown substantially; however, this increase has coincided with a decline in credentials.
- While the number of credentials has declined, funding allocated to the credential portion of the performance funding formula increased 169.4% between FY 2019-20 and FY 2022-23, from about $12.4 million to about $33.4 million. Funding per credential has increased from $784 per credential in FY 2020-21 to $1,058 per credential in FY 2022-23.
- Since the new funding formula has been enacted, the state has bonused $6,843,000 (or almost 7 million dollars) to produce 2,112 fewer credentials.
- The funding disparity per credential is even more pronounced at the institutional level. For instance, the number of credentials dropped from 5,950 in FY 2020 to 5,560 in FY 2023 for the CSU system. In contrast, their credential funding rose, growing from $6.6 million in FY 2024 to $7.3 million in FY 2025, the latest available information at the time of writing. This makes the point or begs the question... is this performance funding or just status quo?
- CSI modeled hypothetical scenarios using Colorado’s current funding formula and potential institutional investment strategies to illustrate the economic value of high-demand, high-ROI degrees. The analysis’ results suggest that increasing investment in credentials of value—those aligned with workforce demand and strong economic returns—would generate greater positive impacts for Colorado’s economy.
- Assuming a 20% increase in the level of Coloradan graduates completing credentials of value, CSI estimates that (spurred by a highly talented pipeline of graduates) nearly 19,000 new jobs would be created in Colorado by 2035.
- Colorado’s higher education institutions could improve alignment between program offerings and high-value credentials tied to labor market demand. Notably, gaps exist in fields such as construction trades; legal studies; physical sciences; social sciences; and biological and biomedical sciences. For example, between 2001 and 2021, only 11 of Colorado’s 32 higher education institutions offered programs in construction.
- Data shows wages are typically either the first or second most important reason students attend college in the first place. CSI modeled a scenario in which the funding formula puts a 50% weight towards credentials of value production and a 50% weight towards earnings outcomes of graduates (with no guaranteed prior year funding base). Based on this assumption, findings suggest that current allocation levels would shift significantly, with three institutions seeing large increases: the University of Colorado (+$91 million), the School of Mines (+$35 million), and the Community College system (+$25 million).
- As Colorado reviews its performance funding model, leaders could find ways to make performance more relevant and ensure the performance metrics include additional incentives for credentials of value.
Recommendations
- As noted later in this paper, the state is unique in what it considers important in funding higher education. The one factor in which the state aligns with most other states is credential production, with at least 62% of states using it in their accountability and funding metrics. In contrast to credential production, the State places significant weight on factors that empirically produce little to no economic value, including:
- Only 42% of states place any weight on Pell-eligible or low-income students.
- Only 28% of states consider an underrepresented background as important for funding.
- We could not find a state that uses a form of first-generation resident headcount in its funding formulas the way Colorado does.
- Graduation rates are used by approximately a quarter of states, with 18% using graduation rate at 100% of the normal time and 22% using the graduation rate at 150% of the normal time.Unlike states such as Florida, Colorado’s current higher education funding formula does not incorporate post-graduation employment outcomes. Introducing employment metrics as an input variable could better align state funding with workforce outcomes and labor market needs. By including workforce outcomes, the formula becomes more balanced. It would then incorporate a core factor driving students to attend higher education in the first place.
- Approximately one-third of states use credentials of value in some form (36%). In looking at job growth across states, states that employ credentials of value in their funding considerations generally see higher job growth. Policymakers may want to include credentials of value in the State’s funding formula.
- The current formula moves slowly. The three and four-year lags in the formula are the reason institutions pay much more attention to the size of the appropriation pie than their share of that pie. Policymakers could move away from such a structure to one in which institutions are offered a base in funding and new funding is allocated based on up-to-date performance for: (1) credentials of value and (2) job placement/employment outcomes. This provides a real incentive to encourage students towards higher lifetime earnings potential while simultaneously preserving core instructional capacity in fields that may not produce high value outcomes. We think this strategy would offer students a well-rounded education that also considers the risk taxpayers are incurring when investing in a student’s future.
Educational Attainment and Workforce Alignment
The Lumina Foundation’s 2024 report, A Stronger Nation, found Colorado leads the nation in post-secondary educational attainment. Nearly two thirds of residents between the ages of 25 and 64, 62.9%, have some form of postsecondary credential. That number is up from 60.5% in 2022. Though Colorado's outcomes are helped by its ability to recruit an educated workforce, much of the increase was due to targeted efforts by schools to improve student success and graduation rates, even as enrollments have fluctuated (recent lower national in-migration trends make up a large factor as well). The state has also invested in targeted programs such as Care Forward, Skill Advance, and Opportunity Now to help Coloradans pursue short-term credentials in high-demand fields. As state resources become more constrained, it is increasingly vital to support students as they pursue industry-aligned, in-demand credentials that lead to long-term economic security.
Credential production does not necessarily correlate with a strong economy or labor market, however, so while Colorado’s high rate of postsecondary credentials is laudable, it is important to examine whether the system truly prepares graduates for success and leadership in high-demand, high-paying jobs by improving access to credentials that are linked to a high ROI for the learner.
Increasingly, there is a growing need to keep postsecondary education accessible, relevant, and aligned with labor market demands. It is no longer enough to only focus on attainment; Colorado’s IHEs should consider offering more value-providing credential pathways that help graduates earn higher wages and build meaningful careers in high-demand industries.
As Colorado reviews its performance funding model, leaders could explore ways to make performance more relevant and ensure the metrics include additional incentives for credentials of value.
To explore the higher education outcome-based funding formula and its effectiveness, CSI utilized data from multiple sources, including: the Post-Secondary Employment Outcomes (PSEO) data explorer tool, Colorado Department of Higher Education (CDHE), Office of Labor Market Information (LMI) at the Colorado Department of Labor and Employment (CDLE), the Colorado Demography Office (SDO), the Massachusetts Institute of Technology (MIT), and the Lumina Foundation. We would like to thank all of these organizations for their commitment to providing valid, robust public datasets.
Growth in State Funding
As indicated, policymakers’ performance funding and other decisions have resulted in somewhat different funding growth rates from FY 2020-21 to FY 2024-25. Since FY 2020–21, Western Colorado University (WCU) has recorded the highest percentage increase in state funding. This growth was largely driven by substantial non-performance-based funding, such as rural higher education, rather than by metrics traditionally used to assess institutional performance, such as student outcomes or degree completion.
In contrast, the CSU system has seen the slowest funding growth during that period. Its increase was just 44%. Are the differences in funding growth effective in producing a stronger, more economically relevant higher education system?
The disproportionate funding growth at institutions like WCU, absent corresponding improvements in performance, suggests Colorado’s funding formula is vulnerable to inconsistencies and supplemental allocations that bypass performance criteria altogether. As a result, institutions critical to the state’s long-term workforce development strategy may be underfunded relative to their contributions and needs.
Figure 3
The rise in funding is occurring even though student enrollment is down at six of the 10 institutions shown (Adams, CSU system, CU system, Mesa, Metro, and UNC). The four growing institutions include CCCS, FLC, Mines, and Western.
Figure 4
Given that the formula is über-lagged (3/4 years) and places only 10% weight on resident full-time enrollment, the formula exacerbates differences in funding per student, depicted below as state funding per resident headcount.
Figure 5
In terms of total funding, Colorado’s three largest public postsecondary systems — the Colorado Community College System (CCCS), the University of Colorado (CU) system, and the CSU system — receive the majority of allocations. As Figure 6 shows, in FY 2024-25, CCCS received approximately 29% of total funding, followed by CU (23%) and CSU (15%).
Figure 6
Share of State Funding
While total state funding for higher education in Colorado has increased significantly across all public institutions over the past five years, the proportional distribution of funding among systems has shifted only marginally. This limited movement is largely a function of the funding formula’s structure, which emphasizes year-over-year continuity and incremental adjustments rather than major redistributions based on changing institutional needs or performance.
For example, the CCCS and the Metropolitan State University of Denver (MSU Denver) — the two systems that experienced the largest increases in their share of total funding — saw their shares rise by only 0.61 percentage points over the five-year period. Conversely, the CU and CSU systems experienced slight declines in their funding shares, decreasing by 0.84 and 0.67 percentage points, respectively, as shown in Figure 7.
This relative stability in funding distribution suggests the current formula lacks the necessary flexibility to meaningfully respond to shifting enrollment patterns, performance metrics, or equity considerations. As a result, institutions that are growing in enrollment or serving high-need populations are slow to see corresponding increases in funding share, limiting their capacity to scale programs, services, or infrastructure to align with student demand or workforce needs.
Figure 7
Performance Funding Methodology Has Minimal Impact
Figure 7 in the previous section shows that budget allocations have changed little over the years because of the marginal adjustments inherent in the allocation formula. Due to the formula structure, institutions have little incentive to shift their instructional preferences for future workforces.
As shown, the performance funding formula matters very little to each institution’s funding. For instance, Adams saw total funding increase 62% over the past five years, but only 0.19% of that growth was due to its improvement relative to the other institutions on performance funding. If the goal is to provide an incentive for economic growth outside of higher education, the current funding formula does not achieve this goal in a material way.
Figure 8
This point is even clearer when examining the percent change in credential funding since FY 2019-20 and the percent change in credentials. As Figure 9 shows, since the funding formula was signed into law, the budget for credential production has expanded significantly while credential growth declined. The slope of these curves became even more dramatic after the funding formula enactment in FY 2020-21.
Figure 9
Broader Trends in Higher Education and the Earners of Degree Holders
Given that the credential production weight of the performance funding formula is of extremely minor importance to the funding of an institution, how are objective measures of output faring in this system?
This section examines each of the eight measures used in the performance funding formula and other potential measures of performance: credential production, resident full-time enrollment, first generation resident headcount enrollment, retention rate, Pell-eligible student share, underrepresented minority student share, graduation rate at 100% of normal time, and graduation rate at 150% of normal time.
Credential Production (5% Weight)
According to the CDHE, a credential is “a piece of documentation that verifies an individual’s qualifications, competencies, or skills, often related to specific job-relevant skills or industry standards, and can include degrees, certifications, or other forms of recognition.” At 5% of the current funding formula, the number of credentials has declined from 48,031 in FY 2019-20 to 45,454 in FY 2022-23 (Figure 9). Interestingly, although the number of credentials has declined, the funding allocated to the credential portion of the funding formula has increased by $12.4 million from what would have been $33.4 million in FY 2019-20 had the formula been in effect in that year.
Overall, given the drop in credentials and the increasing funding for credentials, the cost per credential using just the credential funding portion of total performance funding has gone from $784 per credential in FY 2020-21 to $1.058 per credential in FY 2022-23.
As Figure 10 shows, on a growth basis, Colorado School of Mines has seen the largest increase in credentials. Its credentials have risen 18% since FY 2019-20. Other institutions that have increased their credential output include Mesa College (+1.7%) and the CU System (+ 1.2%). Conversely, the University of Northern Colorado (UNC) and Fort Lewis College (FLC) have seen awarded credentials drop by 15% and 14%, respectively.
While Colorado’s funding formula is partially outcomes-based, CSI’s analysis finds that institutions with declining performance metrics are still receiving substantial increases in funding. This suggests that a significant share of state dollars is not tied to demonstrated performance or value. In effect, this results in funding nonperformance—allocating public resources to institutions without accountability for student outcomes, labor market alignment, or return on investment. Strengthening the formula’s ties to performance indicators, such as credential completion in high-demand fields or graduate employment outcomes, would ensure funding is better aligned with both institutional effectiveness and the state’s economic priorities.
Figure 10
Notably, as Figure 10 suggests, although institutions have had varied success in awarding credentials, the overall number of credentials is down 5% from FY 2019-20 to FY 2022-23. These funding disparities imply that Colorado’s current performance-based funding formula is not functioning effectively in terms of incentivizing or expanding credential production across the state’s public institutions. Other factors, including declining undergraduate enrollment — a trend that has persisted since 2010 — and lingering negative impacts of COVID-19, have also likely led to downticks in higher education’s credential production. Thus, the state has bonused $6,843,000 (or almost 7 million dollars) to produce 2,112 fewer credentials.
Figure 11
At the same time, the credentials portion of the funding formula has grown from about $33 million in FY 2021 to approximately $41 million in FY 2023. Table 1 shows each institution’s estimated share of the credentials portion of the funding formula. Columns 6 and 7 suggest no correlation between subsidy level and credential production.
Table 1
Resident Full-Time Enrollment (10% Weight)
Figure 12 shows the growth or decline in resident full-time enrollment for several institutions.
Only four institutions — Colorado School of the Mines, Adams State University, Western State College University, and Fort Lewis College — have seen a marked increase in these numbers from 2019-20 to 2023-24. The rest either have remained largely the same during this period or declined significantly. Two entities, Colorado Mesa University and Community Colleges of Colorado, now seem to be reversing towards an upswing in enrollment.
Figure 12
First-Generation Resident Headcount Enrollment (5% Weight)
As shown in Figure 13 on the following page, the variation in first generation headcount is wide, ranging from an increase of nearly 80% at Adams State University to a decline of nearly 40% at the University of Northern Colorado.
One factor to consider is that, for this metric, percentage growth is sensitive to the student base. For instance, a 200-student increase in first generation students at Adams State is a much larger relative increase than a 200-student increase at the University of Colorado. In order to provide context, the next page also shows the total count of first-generation students by institution.
Figure 13
Figure 14
Pell-Eligible Student Share (20% Weight)
The term “Pell-eligible” refers to students with an Estimated Family Contribution (EFC) low enough to qualify for federal Pell grants, regardless of whether the student receives a grant. With this, both graduate and undergraduate students are considered. Colorado’s formula does not seem to have led to much of an increase in students eligible for Pell Grants. The following two figures show the share of students eligible for Pell Grants by institution and the percentage change in the share of Pell-eligible students.
Figure 15
Figure 16
The two figures on this page examine the Pell-eligible headcount relative to the total population of students and the growth or decline in the share of students eligible for Pell Grants as a percentage of total students with the growth in state funding.
Figure 17
Figure 18
Underrepresented Minority Share (20% Weight)
The next figure examines growth in underrepresented minority students relative to the change in the budget for these students. As shown, there is little connection between the two numbers. This outcome stems partly from the lookback nature of the formula, where three-year and four-year average changes are used to share out a growing pie. As has been noted, the budget continues to grow regardless of performance.
Figure 19
Retention Rate (20% Weight)
Figure 20 shows the growth or decline in student retention from FY 2019-20. Only four institutions — Colorado School of the Mines, Fort Lewis College, the CSU system, and the University of Colorado — have improved since the current formula was put into place.
Figure 20
As Figure 21 shows, graduation rates for students completing a degree within the normally allotted time to complete the degree also have not improved with the current formula. Given the nature of this variable, the normal graduation rate may be more of an effect than a cause that can be meaningfully influenced to a sufficient degree by institutions. Thus, the lack of much improvement in the measure.
Figure 21
Graduation Rate at 150% of Normal Time (10% Weight)
Figure 22 indicates that graduation rates for students completing a degree over a longer time horizon also have not improved with the current formula.
Figure 22
What Other States Are Doing
While Colorado incorporates several important metrics into its performance-based funding model, it lacks a clear emphasis on student progression and alignment with workforce needs. As the following examples show, other states clearly prioritize these areas.
Tennessee. With the Complete College Tennessee Act of 2010, Tennessee shifted its funding model toward performance metrics. These factors now encompass around 80% of the allocation of points awarded by the state. Tennessee’s formula also incorporates premiums to prioritize outcomes involving underserved populations, including adult and low-income students, and degrees in high-need academic fields like STEM and health care.
Tennessee’s funding formula also distinguishes between community colleges and four-year institutions by employing distinct performance indicators for each sector. This differentiated approach allows for more tailored accountability and resource allocation. Notable and innovative inputs used in Tennessee’s model include:
- The total number of short-term certificates — defined by the state as a certificate that requires less than 24 credit hours — awarded during an academic year;
- The number of long-term certificates — a certificate that requires more than 24 credit hours — awarded during an academic year;
- Job placement, which encompasses all work-eligible or work-capable graduates employed within a year of graduation; and
- Non-credit workforce training hours that students complete in an academic year.
Texas. In 2023, Texas adopted an outcomes-based formula to allocate state funding to its community colleges. The formula aims to align institutions with Texas’s educational goals and workforce needs. Texas’s formula weights outcomes affecting target populations, including economically disadvantaged students (25%), academically disadvantaged students (25%), and adult learners (50%).
The first metric Texas uses is the number of students completing 15 semester credit hours (SCHs) of dual credit or dual enrollment through an institution, provided these hours meet degree or workforce credential requirements.
The second indicator is the number of students who complete 15 SCHs and either transfer to a Texas public university or enroll in a structured co-enrollment program.
The final metric is the total number of degrees and credentials awarded, encompassing bachelor’s and associate degrees, Advanced Technical Certifications (Levels 1 and 2), occupational skills awards, Institutional Credentials Leading to Licensure or Certification (ICLCs), Opportunity High School Diplomas, and Third-Party Credentials. (An Opportunity High School Diploma refers to earning a high school diploma through concurrent enrollment in a competency-based education program.) For these credentials, specific criteria apply: Among other requirements, ICLCs must meet a minimum total contact-hour requirement, and certificates are counted only if, on average, they yield a positive ROI within certain timeframes, ensuring only credentials of value contribute to this measure. Additionally, extra weights are applied to degrees in high-demand fields as defined by the Texas Higher Education Coordinating Board.
Florida. Several components of Florida’s outcomes-based funding model are explicitly designed to align institutional performance with the state’s broader educational and workforce priorities, thereby linking public investment in higher education to measurable economic and policy goals. Efforts include:
- The number of bachelor’s degrees awarded in “programs of strategic emphasis” like STEM, with double majors double-counted;
- Median wages of full-time bachelor’s degree graduates a year out from graduation, excluding self-employed, military, or minimum-wage workers; and
- An institution-specific benchmark that allows IHEs to choose a unique component they would like to be measured on that’s tailored to its goals and strengths. Examples include:
- Florida Poly measures workforce experiences;
- UCF looks at the total number of degrees awarded to Hispanic and African American students; and
- UF examines its endowment size.
Colorado’s Funding Model Compared to Other States
Colorado’s higher education funding model is distinct in its reliance on a base-plus approach whereby annual allocations begin with prior-year funding levels and are then adjusted marginally using the eight specific variables already discussed.
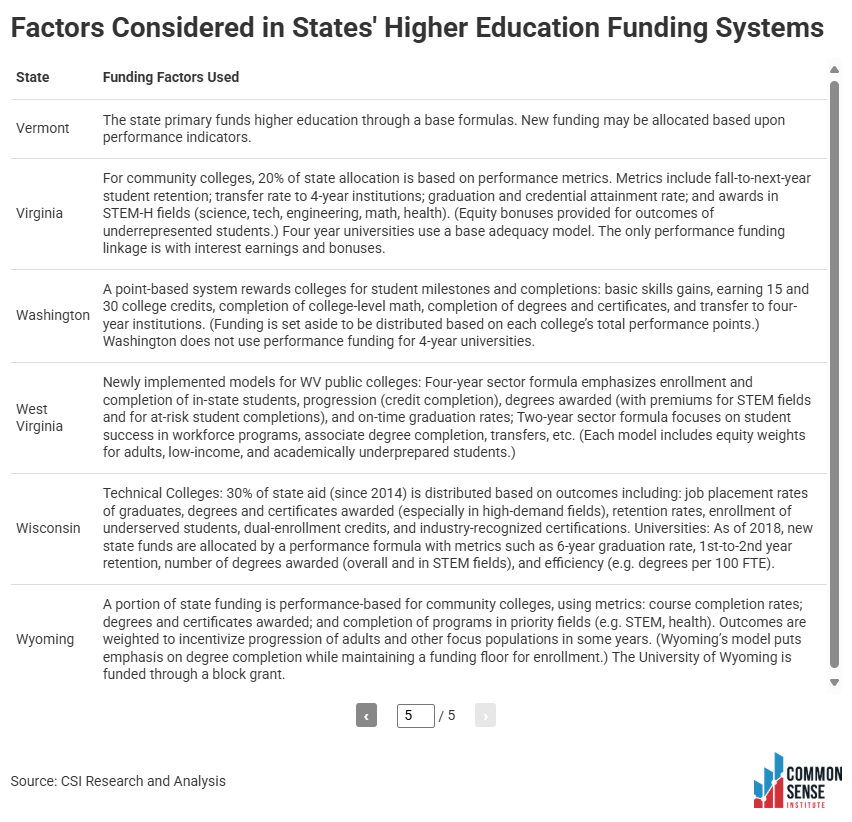
As Figure 23 shows, Colorado is one of 26 states that use some sort of base funding model. As Figure 24 on the next page demonstrates, 19 other states incorporate performance or outcomes funding in a marginal or supplementary manner. Another 13 states apply performance-based funding selectively — typically limited to certain sectors such as community colleges — while 18 states do not employ any form of performance or outcomes-based funding.
This comparative positioning highlights Colorado’s cautious adoption of performance funding mechanisms. While the state has taken steps to reward institutions based on student outcomes, the modest scale and limited influence of these metrics in the overall funding formula suggest performance-based funding plays a secondary role relative to historical funding levels. As such, Colorado may benefit from further refinement of its model to more meaningfully connect state appropriations to institutional performance, and workforce alignment – the current model drives little or no motivation to change or perform.
Figure 23
Figure 24
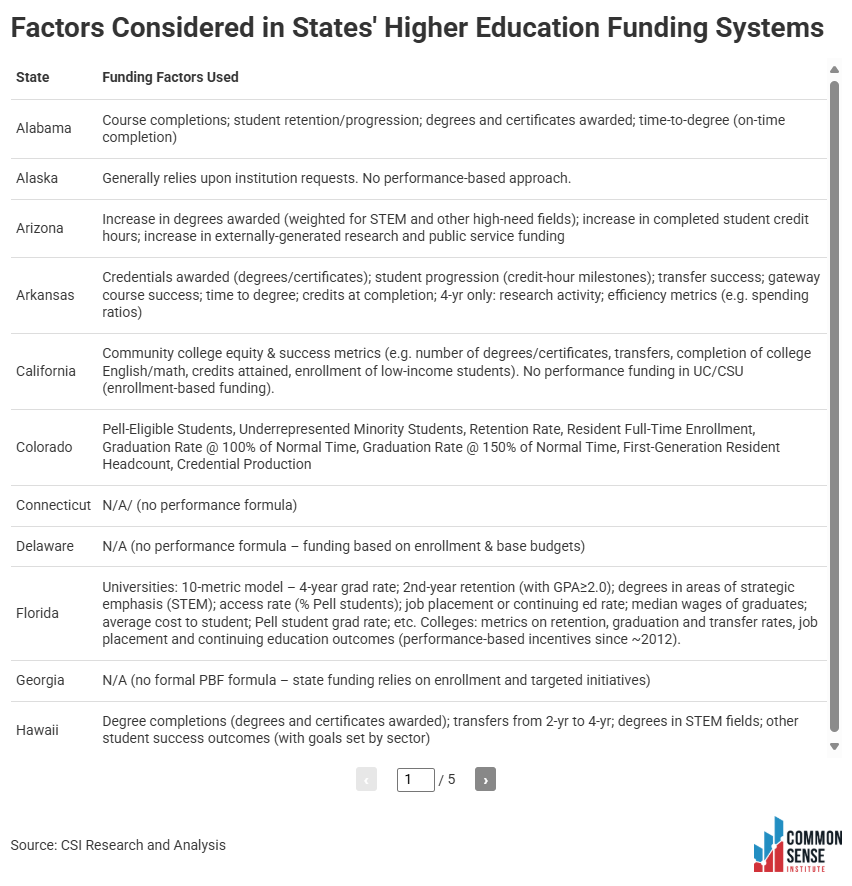
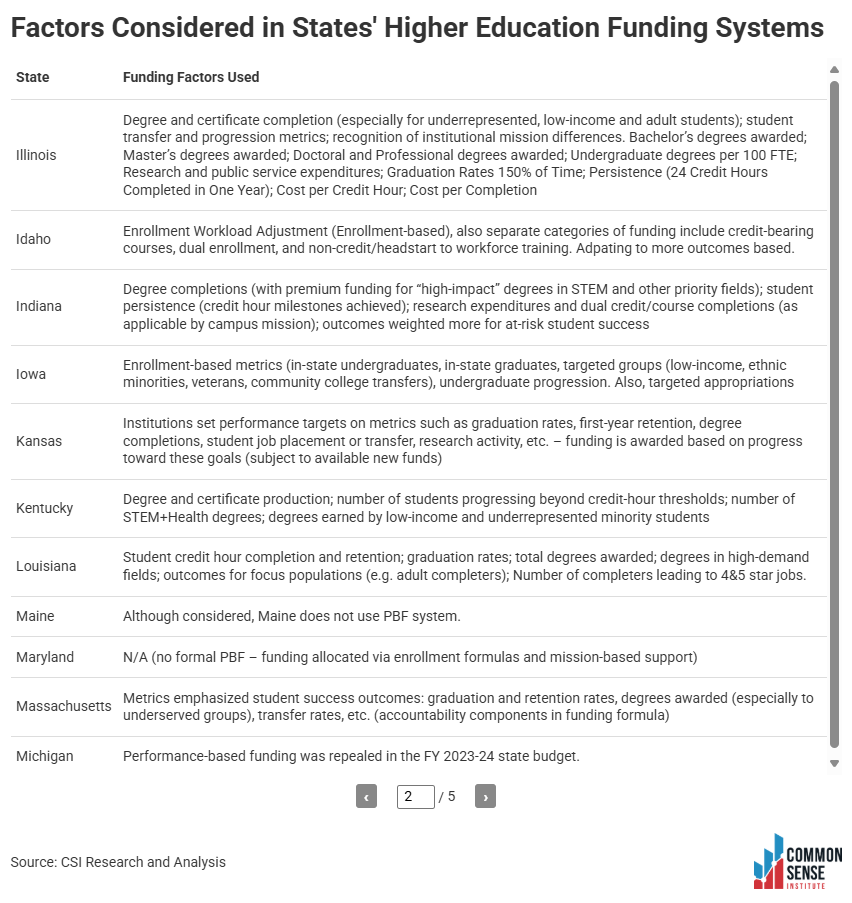
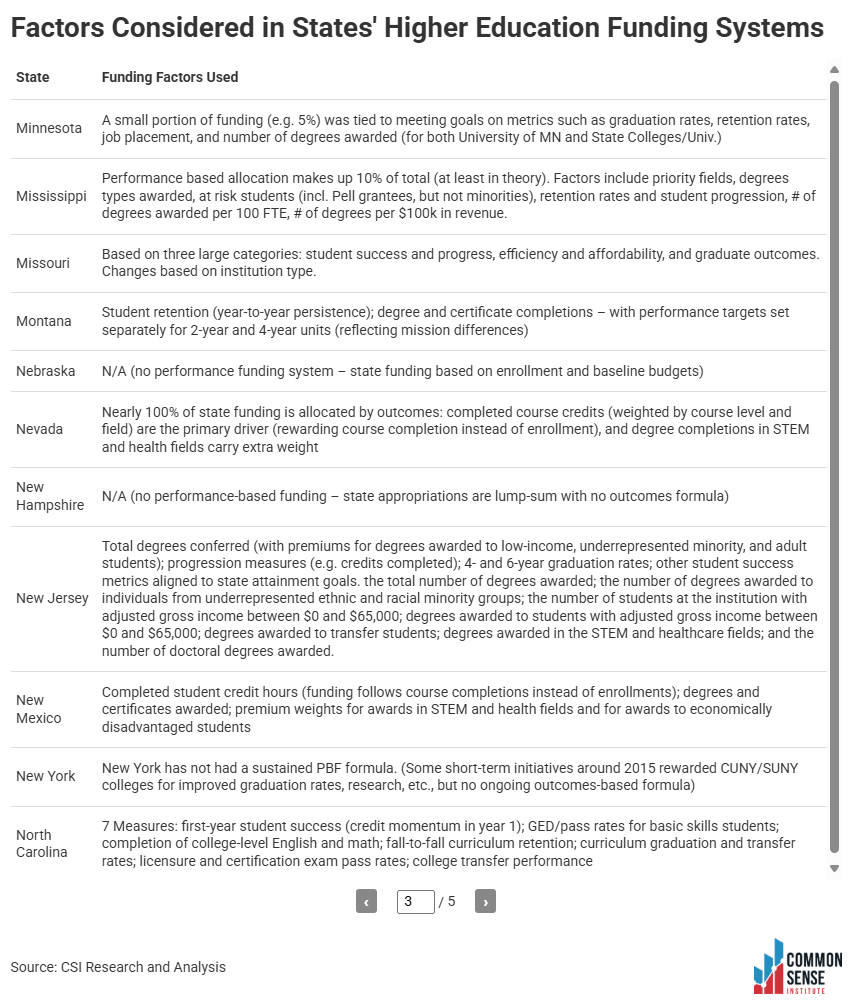
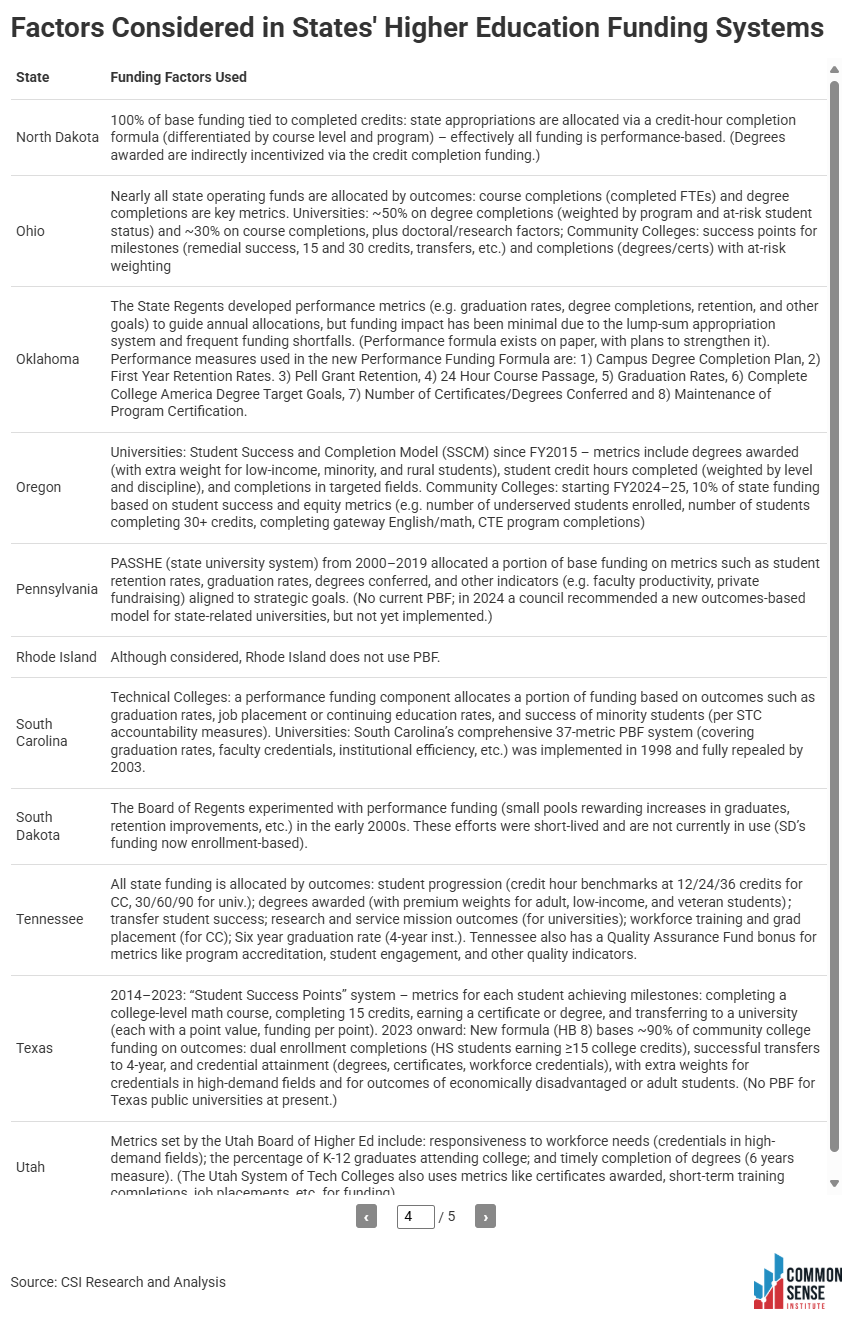
Further Details on What Other States Consider
Given this background, how does Colorado compare with other states in terms of what is considered in funding formulas? In terms of how they compare with Colorado, the following table indicates how many of the other 50 states consider the same or similar factors as Colorado. Overall, the top three factors Colorado considers that other states also generally consider are credential production (62%), low-income students (42%), and retention rate (30%). No states consider first generation headcount, and only 28% consider underrepresented minority student share. When looking at performance funding, resident full-time students (6%), graduation rate at 100% of the normal time (18%), and graduation rate at 150% of the normal time (22%) are also infrequently used. Recently, growing interest among states concerns job placement/employment, with 22% of states now placing some sort of consideration of this outcome in funding.
Further details on other states’ funding considerations is given in Appendix C.
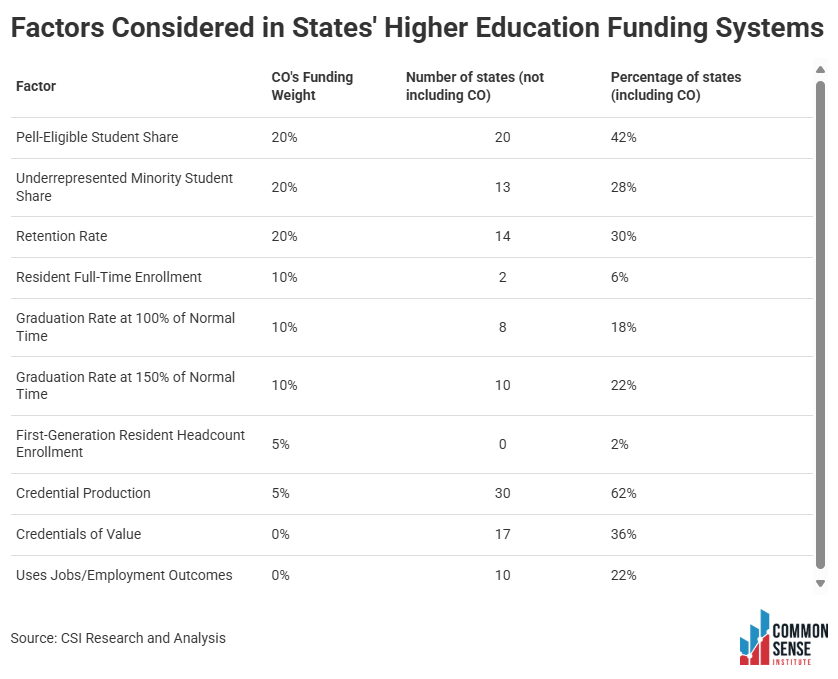
Table 2
Connecting Degrees with Jobs and Performance Funding Factors with Degrees
Given the divergence in factors considered in performance funding, is there a connection between one, some, or all of the factors Colorado considers and degrees/certificates of value, as represented by scientific and engineering degrees?
Degrees of Value (Credentials of Value) and Jobs
Before looking at the connection between performance funding factors and degrees, the following figure shows the correlation between the percentage of degrees awarded for science and engineering and the percentage of STEM jobs per total employment. Unsurprisingly, the state is high on both science and engineering degrees as a percent of total and STEM jobs as a percent of total employment. Colorado has a long tradition of being a technologically capable population with a workforce able to compete with any state in the country in science, technology, engineering, and math. The simple linear regression correlation of the following figure is given in Appendix B.
Figure 25
What if Colorado’s Funding Model Placed Significantly More Weight on Credentials of Value?
Colorado’s current funding formula does not consider credentials of value connected to the state’s labor market. Instead, as noted at the outset of this report, the current funding model has only three weighted payment thresholds across eight different performance funding measurements that, together, deliver funding to institutions across the state.
This section explores CSI’s empirical outcomes for Colorado graduates earning attainment credentials linked to: High ROI; high-need, high-demand in the labor market; and their associated supply and demand workforce gaps.
CSI evaluates the top ROI focus areas for four-year degrees and short-term credentials (one to two years) in Colorado, as well as the projected workforce needs for these fields. Using these factors, CSI estimates: Gaps in employer demand and the supply of graduate talent, labor productivity, and economic mobility.
Findings suggest that if the state centered its outcome-based funding formula to strategically include credentials of value, Colorado’s institutions could set the national stage in terms of bridging workforce gaps and bolstering graduates’ economic mobility.
Labor Market and Economic Mobility
Credentials of value, which refer to any post-secondary credentials, including degrees, certificates, and certifications, that provide learners with the skills and knowledge necessary to secure strong career pathways, high-paying jobs, and economic prosperity.
They are essential to help meet any state's workforce demands.
As such, in recent years, credential production and stackable credential pathways have been top-of-mind at the Colorado Department of Higher Education (CDHE), including through the passage of SB 22-192. This 2022 legislation provided the CDHE funding to work with other government agencies, stakeholders, K-12 educators, and higher education institutions to develop 10 stackable credential pathways in high-need, high-demand industries by the end of 2025.
The problem with this legislation is that some of these proposed high-need pathways, such as behavioral health and education, typically do not provide wages that meet the minimum earnings threshold to be able to live in Colorado.
While graduates’ ability to secure a job in a high-demand, high-growth sector in the state should be considered when institutions expand credential programs, other factors, like income, also must be considered.
Why? Because in 2023, 50% of all bachelor’s degree graduates in Colorado left their campuses facing debt. Average debt was $25,200 per student, with 9% of graduates accruing debt greater than $40,000. Compounding the debt issue is the fact that Colorado is currently the 19th most expensive state to live in in the United States. A high and growing cost of living means a robust ROI in higher education fields of study is necessary to attract and retain learners to the state. Because of this need, CSI considered both financial returns to the worker and workforce demand in its analysis.
Figure 26 reports data on the highest ROI four-degree majors and short-term credentials in Colorado. These findings are based on 10-year median earnings post-graduation. Most of these credentials are associated with STEM. These fields are also linked to the high-growth occupations in Colorado between 2023 and 2033. Seven of the top 10 projected employment gains in the state by occupation are associated with the credentials listed in Figure 26. Table 3 lists these occupations and their associated expected growth rates.
Figure 26
|
Credential of Value Title
|
Associated Labor Market Occupation Title
|
Associated SOC 2-digit Occupation Title
|
Employer Demand: Total Percent Change: 2023-2033 (%)
|
|
Computer and Information Sciences and Support Services
|
Computer and Mathematical
|
15
|
+28.33%
|
|
Health Professions and Related Programs
|
Healthcare Support Services
|
31
|
+25.46%
|
|
Construction Trades
|
Construction and Extraction
|
47
|
+22.43%
|
|
Legal Professions and Studies
|
Legal
|
23
|
+21.90%
|
|
Physical Sciences; Social Sciences; Biological and Biomedical Sciences
|
Life, Physical, and Social Science
|
19
|
+20.76%
|
|
Engineering; Engineering Related Technologies; Architecture and Related Services
|
Architecture and Engineering
|
13
|
+17.93%
|
|
Business, Business-related Management, Marketing, and Support Services
|
Business and Financial Operations
|
17
|
+17.60%
|
Table 3
Based on total percentage change of expected employment, computer and information sciences and support services are projected to see the highest spike in occupational growth out of any occupation group between 2023 and 2033, rising by more than 28% and projecting 131,650 annual job openings in the state. These occupations are also associated with the highest earnings for any four-year degree earner. Healthcare professions and related programs are associated with the second highest growth in the state during this period, increasing by more than a quarter of their current level. The healthcare support services sector, taken together with healthcare practitioners and technical occupations, is expected to grow by 163,410 job openings between 2023 and 2033. Construction trades jobs, which are linked to the highest ROI for one- to two-year short-term credentials in Colorado, are expected to grow by roughly 22%, or an estimated 198,700 openings between 2023 and 2033.
Table 4 offers the count of graduates who completed a credential of value within the projected high-growth, high ROI fields of study reported in Table 3, disaggregated by Colorado's IHEs. The data findings include graduation counts across all levels of educational attainment, from short-term certificates (less than one year) to doctoral and professional degrees. The results provide insight into how effectively individual institutions are contributing to the development of talent aligned with Colorado’s labor market demands and value to both graduates and the state’s economy.
Historically, Colorado’s institutions of higher education have demonstrated relative efficiency in aligning academic programs with the state’s evolving workforce demands in some high ROI fields of study. This outcome is particularly evident in fields such as health professions and related programs, which accounted for 105,050 graduates between 2001 and 2021. Among these occupations, the University of Colorado Denver and Front Range Community College accounted for the largest share of graduates, with 14,887 and 14,444, respectively. Academic programs in business, management, marketing, and related support services yielded 93,167 graduates over the same time frame. The University of Colorado Boulder and Colorado State University led in business-related degree completions, producing 15,644 and 15,449 graduates, respectively.
The data also reveal areas where Colorado’s higher education institutions could improve alignment between program offerings and high-value credentials tied to labor market demand. Notably, gaps exist in fields such as construction trades; legal professions and studies; physical sciences; social sciences; and biological and biomedical sciences. For example, according to Post-Secondary Employment Outcomes (PSEO) Census data, only seven out of the state’s 32 higher education institutions offered programs in legal professions and studies between 2001 and 2021. These programs produced only 4,675 graduates statewide. The University of Colorado Boulder accounted for a significant portion of these graduates, contributing 2,714, or more than half of the total.
At the same time, completion in construction trades has been limited. Between 2001 and 2021, only 11 of Colorado’s higher education institutions offered programs in this field, collectively producing just 11,432 graduates over the course of two decades. As mentioned above, this field is linked to the highest ROI for short-term credentials in the state. This modest output underscores a significant gap in meeting the state’s demand for skilled tradespeople, despite persistent labor shortages and strong job growth projections.
The limited institutional presence in certain high-ROI, high-need, and high-growth areas suggests opportunities for strategic program expansion to better support Colorado’s evolving labor market.
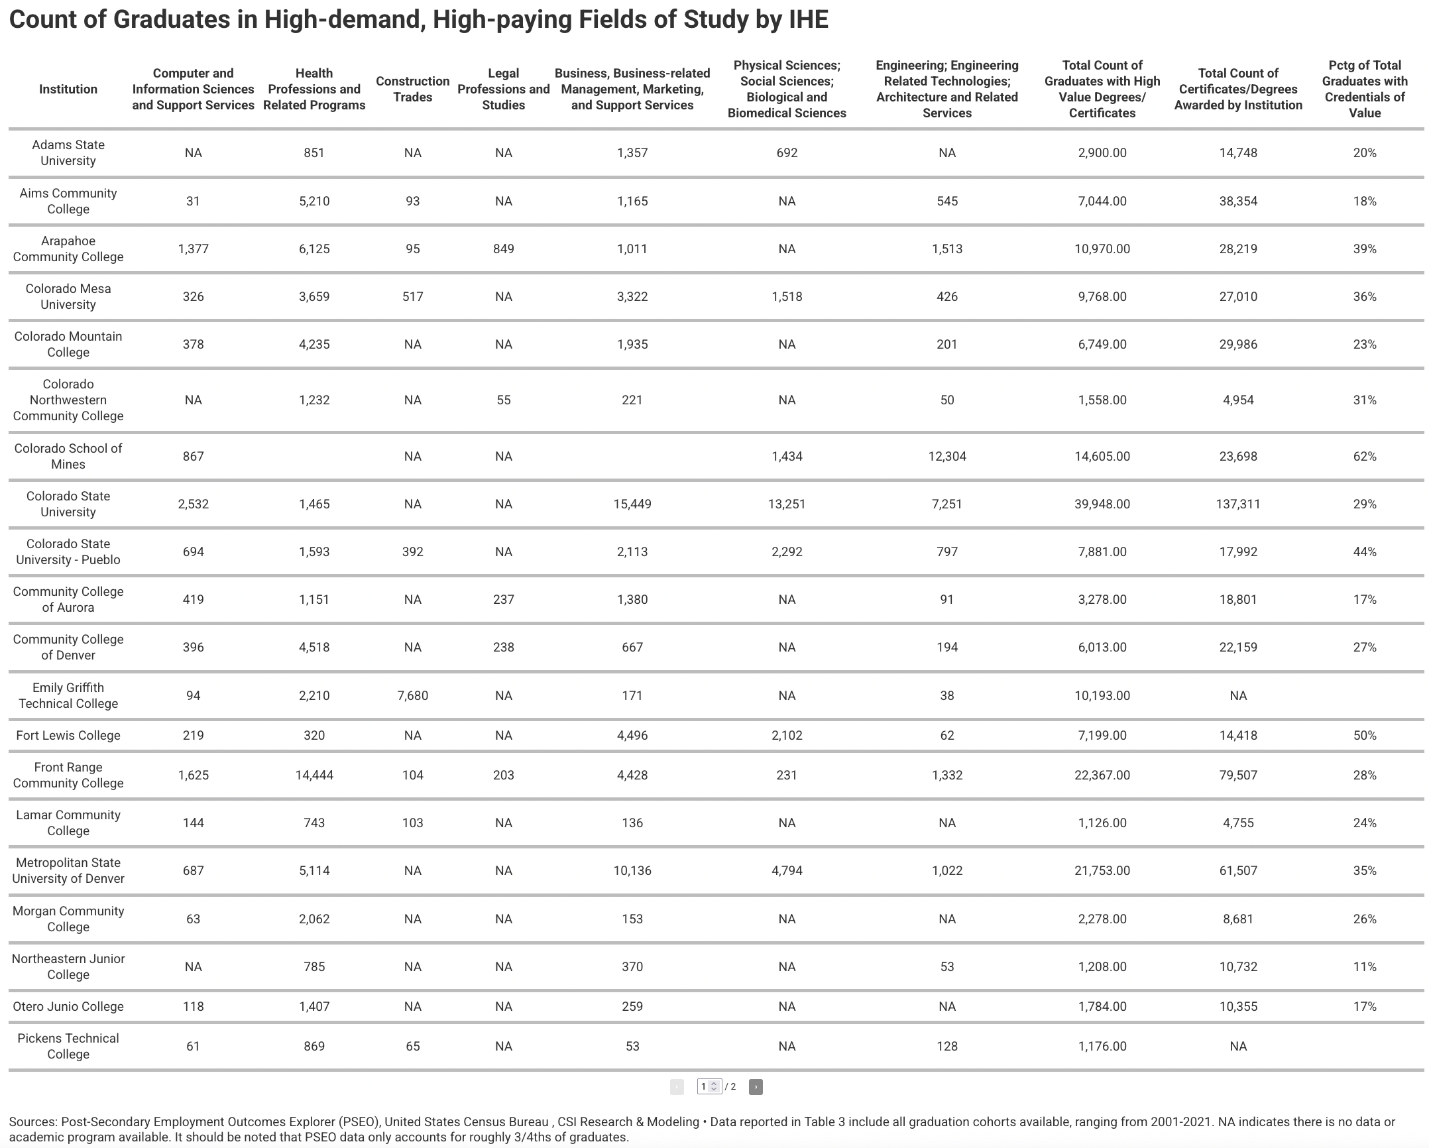
Table 4
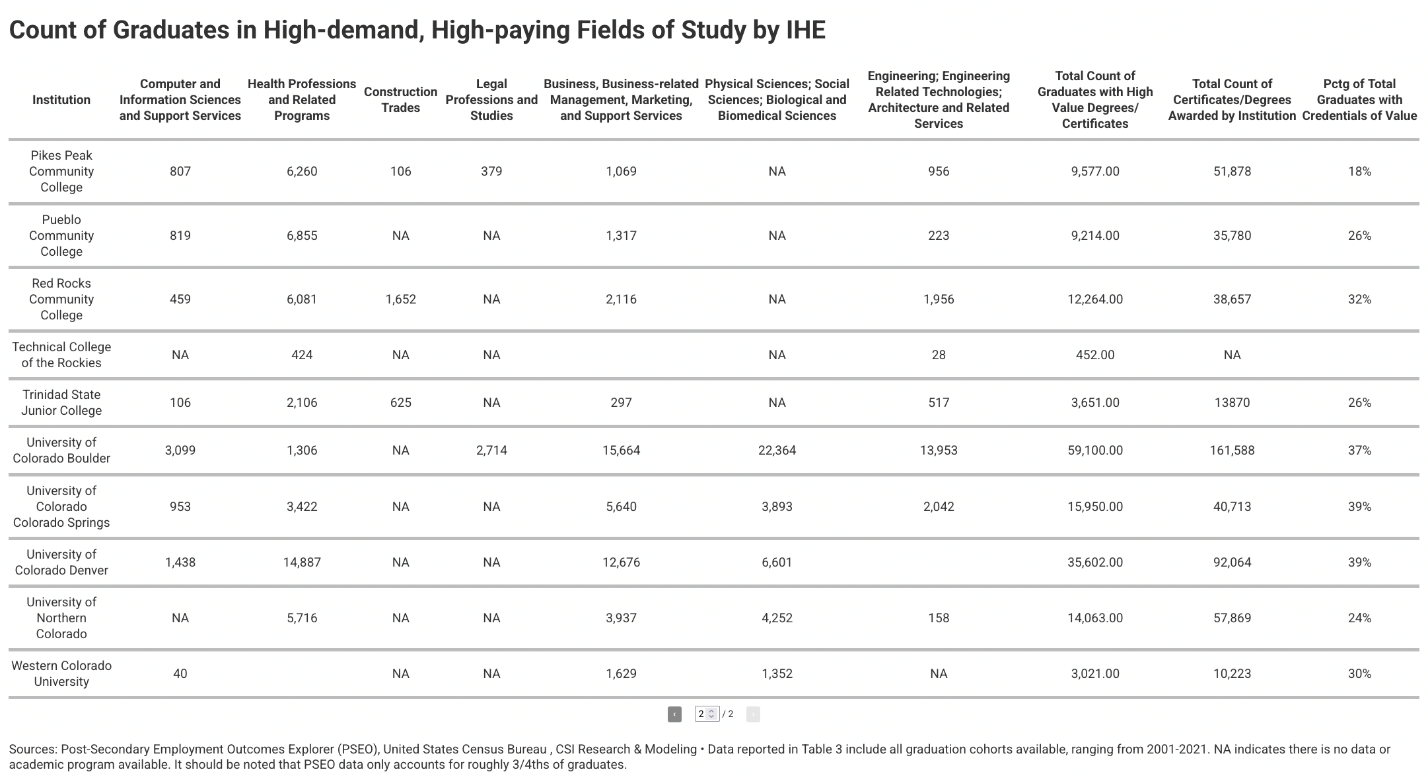
Table 4 continued
Another view of the data is the share of overall credentials for the identified areas awarded by the institutions in the previous table. The following figure shows that comparison based upon the National Center for Education Statistics’ Integrated Postsecondary Education Data System.
The top five institutions with the highest share of degrees/certificates awarded in these valuable areas from 2001-2021 comprised of (share of degrees in parentheses):
- Colorado School of Mines (62%)
- Fort Lewis (50%)
- Colorado State University, Pueblo (44%)
- Arapahoe Community College (39%)
- University of Colorado, Colorado Springs (39%).
On the other end of the spectrum, the lowest five institutions for degrees/certificates awarded in these areas included:
- Community College of Denver (31.2%)
- Northeastern Junior College (29.4%)
- University of Northern Colorado (25.5%)
- Western Colorado University (24.1%)
- Adams State University (13.8%).
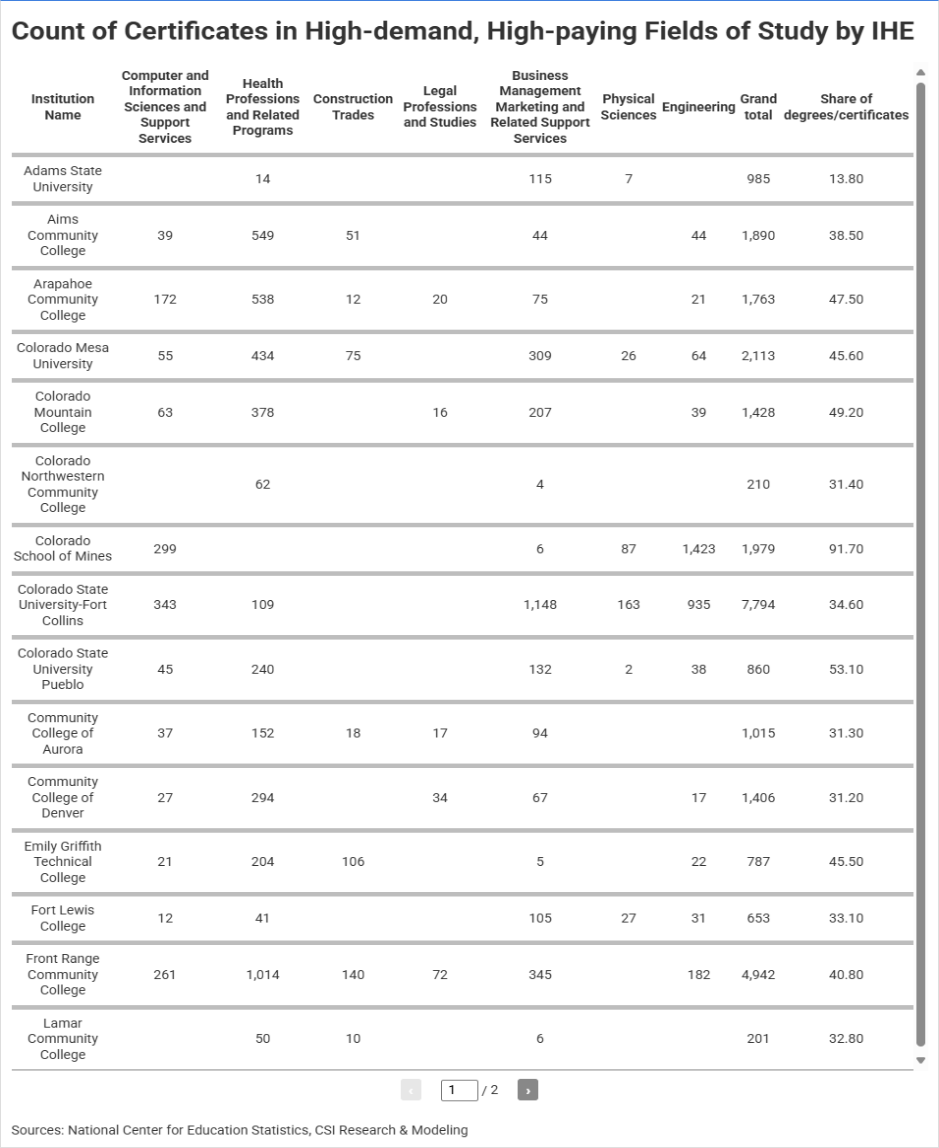
Table 5
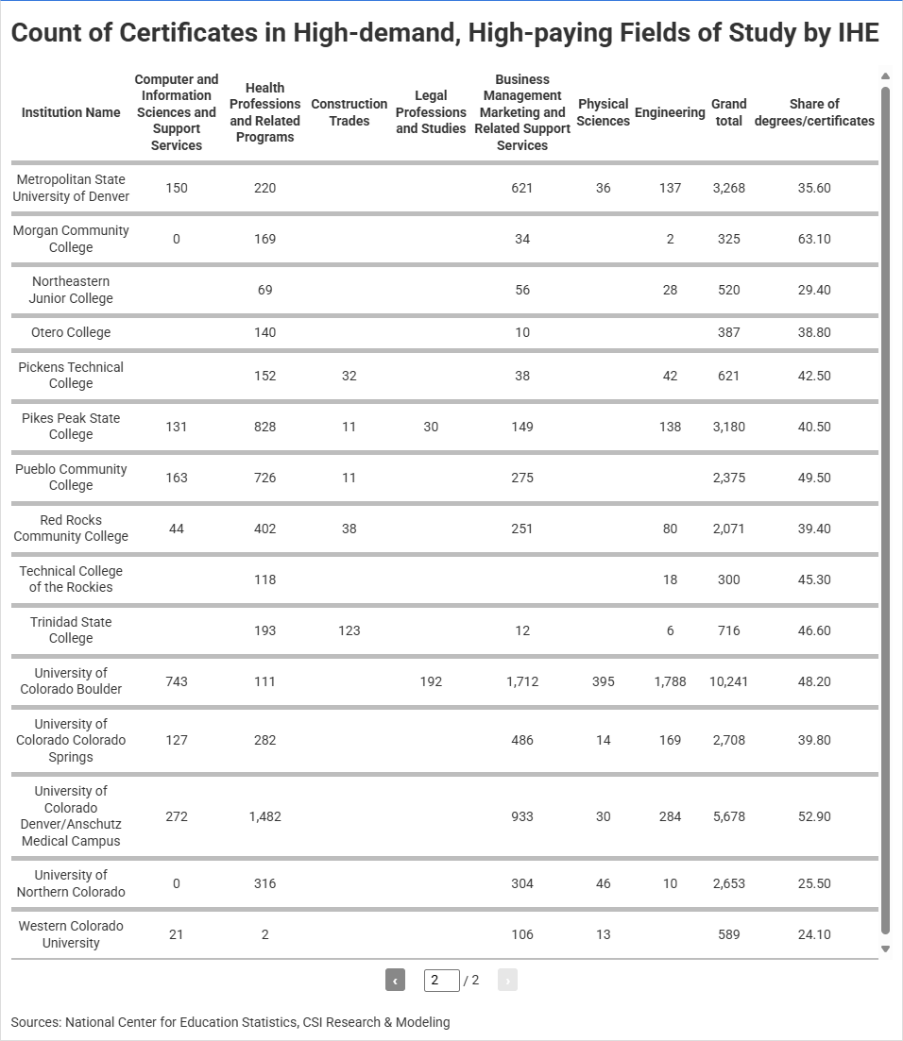
Table 5 continued
Credentials of Value Could Boost Enrollment, in Theory
Higher education is currently in a period of volatility. According to Fitch Ratings projections, ongoing enrollment challenges will continue to drive financial strain. By scaling up credential of value initiatives, Colorado’s higher education institutions could mitigate financial pressure while advancing student and state-level economic outcomes.
Not only could credentials of value performance outcomes support the talent pipeline and workforce in Colorado, but they could also help address current concerns about prolonged downturns in college enrollment. According to the Colorado Legislative Council’s enrollment forecast, enrollment growth across the state’s institutions is expected to slow from 3.6% growth in 2023-24 to 3.4% in 2024-25 to 1.8% 2025-26.
Figure 27 displays the most recently available enrollment trends across the largest 10 institutions of higher education in Colorado. In general, many institutions experienced slight upticks in the level of learners between 2018 and 2019, followed by a more significant downtick between 2019 and 2021.
Figure 27
Assuming rational theory, when the time and financial costs of obtaining a postsecondary credential outweigh its perceived labor market value, potential learners are not incentivized to enroll. Declining enrollment and credential completion present significant risks, particularly at a time when sustained productivity is essential to maintain U.S. global competitiveness. Higher education plays a critical role in workforce development, but without sufficient investment in competitive, outcomes-driven programs, long-term labor market stability remains uncertain.
Expanding access to high-value credential programs, especially short-term, high-return options, could incentivize greater participation among Colorado students. By prioritizing such pathways, the state has the potential to emerge as a national leader in undergraduate outcomes and labor market alignment.
How Coloradans Can Earn a More Than a Livable Wage through Higher Education
The Massachusetts Institute of Technology (MIT) Livable Wage threshold was estimated to be $52,981in 2025. This amount represents the lowest level a Coloradan must earn to sustain oneself based on typical regional expenses such as food, childcare, and housing.
The wage estimates in Figures 28 and 29 show how much more top earning four-year and short-term credentials earn above the livable wage. As Figure 28 shows, computer and information sciences and support services bachelor’s degree earners have the highest median wage post-graduation at 54% above the livable wage threshold. This category is followed by engineering degree holders (54.1% above the livable wage threshold), mathematics and statistics graduates (41.3% above the threshold), and transportation and material moving graduates (40.9% above the threshold).
Figure 28
In terms of shorter-term credential earners’ wages, construction trades far outpace other categories, landing at 32% above the livable wage threshold post-completion. This sector is followed by homeland security, law enforcement, firefighting, and related protective services credentials, health professions and related programs completers, and legal professions and studies who, as Figure 29 shows, earn 24.4%, 22.2%, and nearly 15.9% above Colorado’s livable wage threshold, respectively.
Figure 29
How Would Funding Shift Between Institutions If the Funding Formula Considered Other Factors
As noted earlier, the current funding formula has virtually no connection with outcomes and is too slow to provide a material incentive for action. Acknowledging that, how would funding shift among institutions if the state opted for:
- Scenario 1: A 100% funding allocation towards credentials with no guaranteed funding base of the prior year’s funding amount.
- Scenario 2: A 100% funding allocation towards credentials with a guaranteed funding base of the prior year’s funding amount.
- Scenario 3: A 100% funding allocation towards credentials of value with no three- and four-year lags and no guaranteed prior year funding base.
- Scenario 4: A 100% funding allocation towards credentials of value with no three- and four-year lags and a guaranteed prior year funding base.
- Scenario 5: A 50% weight towards credentials of value and a 50% weight towards earnings outcomes with no guaranteed prior year funding base.
- Scenario 6: A 50% weight towards credentials of value and a 50% weight towards earnings outcomes with a guaranteed prior year funding base.
Scenario 1: 100% Funding Allocation Towards Credentials with No Base
The slow-moving nature of the funding formula is readily transparent when comparing the status quo with funding options that place greater weight on career-oriented results and/or allow for funding to respond to performance quicker. For instance, the following figure is the shift in state funding that would occur if the state opted to fund institutions based solely on credentials. In this scenario, Colorado’s Community College (CCC) system and the University of Colorado (UC) system would see the largest increases in funding, rising by approximately $84 million and $44 million, respectively, relative to their FY 2025-2026 baseline funding. On the other end of the spectrum, Denver Metro, Fort Lewis, and Western would see their funding drop by approximately $30 million, $17 million, and $16 million, respectively. From this perspective, CCC and CU are subsidizing every other institution.
Figure 30
Scenario 2: 100% Funding Allocation Towards Credentials with Guaranteed Funding Base
Scenario 1 looked at a 100% funding allocation towards credentials. What if only new funding were allocated towards credentials, with each institution guaranteed 100% of their prior year funding? The following figure shows that view.
Overall, in this moderate funding shift scenario, rather than large shifts among institutions due to years of some institutions subsidizing certain other institutions, the funding shifts are moderate. The largest shifts with increases in funding from new money include CCC and UC, up $2.1 million and $1.1 million, respectively. In contrast, Denver Metro, FLC, and Western see funding drops of $1.6 million, $0.5 million, and $0.3 million, respectively.
Figure 31
Scenario 3: 100% Funding Allocation Towards Credentials of Value with No Guaranteed Funding Base and No 3/4 Year Lag
Scenarios 1 and 2 looked at the shift in funding if credentials were the sole deciding factor in funding and whether or not institutions were guaranteed prior year funding. Scenario 3 looks at funding assuming 100% of the funding allocation was based on credentials of value, with no guaranteed funding base and no 3/4 lag.
Overall, if credentials of value were the deciding factor for all money, the University of Colorado system and the School of Mines would see an enormous increase in funding of approximately $136 million and $38 million, respectively. In contrast, Denver Metro (-$47 million), UNC (-$42 million), and Adams (-$23 million) would see the largest drop in funding.
Figure 32
Scenario 4: 100% Funding Allocation Towards Credentials of Value with Guaranteed Prior Year Funding Base and No 3/4 Year Lag
Scenario 4 is the same as Scenario 3, with the exception that institutions are guaranteed their prior year’s funding amount.
Overall, in this scenario, funding would shift from the subsidized to the historical subsidizer, with four institutions—the University of Colorado system (+$3.4 million), School of Mines (+$0.8 million), CCCS (+$0.3 million), and the CSU system (+$19,000).
Figure 33
Scenario 5: A 50% Weight Towards Credentials of Value and a 50% Weight Towards Earnings Outcomes with No Guaranteed Prior Year Funding Base
Scenario 5 continues with the credentials of value funding assumption and adds a 50% towards job earnings results. Although a gold standard method for capturing earnings post-graduation for students in the state is unavailable, for this exercise, we used the earnings outcomes as reported by the Post-Secondary Employment Outcomes Explorer provided by the U.S. Census Bureau. Average earnings were calculated for each institution for the most recent cohort using the bachelor's degree recipients as the measure, with the exception of Colorado’s community colleges, in which case we used the earnings of associate's degree recipients. The earnings estimate employed the p50 (middle point) estimate.
Before presenting the budget impact results, the following figure presents the assumed earnings outcomes. Of the 10 institutions, the School of Mines has the highest typical (50th percentile) earnings estimate one year after graduation, followed by the Colorado State University system and the University of Colorado system. On the other end, Fort Lewis, Western, and Adams have the lowest earning graduates.
Figure 34
Given the just-mentioned assumptions, the following figure looks at the shift in funding if it were allocated with a 50% weight on graduates’ earnings post-graduation and 50% based on credentials of value.
Before looking at the results, a note on the weight allocations: For the 50% earnings share, each institution’s mid-point earnings estimate was multiplied by the number of credentials awarded to get an estimate of total wages generated by that institution. From this estimate, each institution’s share of the total estimate’s wages was estimated and multiplied by the 50% weight.
Overall, when considering credentials of value and an institution’s share of total wages generated in the economy, funding would shift significantly in the coming year, with three institutions seeing large increases: the University of Colorado (+$91 million), the School of Mines (+$35 million), and the Community College system (+$25 million).
On the other end of the spectrum, institutions that generally fail to produce significant wages in the economy relative to their current funding allocation include, among the other institutions: Metro (-$44 million), University of Northern Colorado (-$32 million), and Adams (-$20 million).
What the results of this Scenario 5 show is that some institutions’ graduates are much better at generating wages than others. And remember, wages are either the first or second most important reason students attend college in the first place.
Figure 35
Scenario 6: A 50% Weight Towards Credentials of Value and a 50% Weight Towards Earnings Outcomes with a Guaranteed Prior Year Funding Base
Scenario 6 continues what Scenario 5 introduces and adds the caveat that an institution’s prior year funding amount is guaranteed. This ensures that no institution experiences a decrease in funding.
As one would expect, the shift among the institutions is less, with no institution seeing an actual decrease in funding from their 2025 baseline, but funding for some institutions growing faster than others.
Figure 362
The Scenarios with Guaranteed Baselines
Three of the scenarios guarantee baseline funding at the prior year’s amount plus an institution’s share of the growth in funding.
As shown, no institution sees a decrease in funding from their current 2025 baseline funding. The difference lies in how fast funding grows. For institutions that are producing the most impact on the economy—as measured by wages added to the economy, credentials of value, or simply credentials—they see faster growth in their funding.
Figure 37
Checking the Connection Between Funding Formula Inclusion of STEM-Related Degrees and Average Job Growth
One way to inspect the connection between funding formulas and job growth is to empirically inspect whether states that include STEM-related incentives in their funding formula have higher average job growth. In the model result below, average job growth is defined as average year-over-year job growth by month from February 2021 through April 2025. The following regression results provide an estimate.
The regression uses information gathered on factors used across states that Colorado also uses. Overall, the estimate of relevance to this discussion is the “Coefficient” on Uses Credentials of Value STEM, which is estimated at 0.166 with a 90% confidence level. This indicates that when a state adopts credentials of value in its higher education funding formula, it can expect 0.166 more percentage points in job growth. When applying the 0.166 to Colorado in June 2025, the 0.166 would equate to 19,100 more jobs in Colorado today than what occurred. This is surprisingly similar to the 20% scenario presented in the REMI results section below.
|
Linear regression for Average Job Growth from 2/2021 to 5/2025
|
|
Ln of Average Job Growth in CO
|
Coef.
|
Standard Error
|
t-value
|
p-value
|
Sig
|
|
Credential Production
|
-0.025
|
0.08
|
-0.32
|
0.753
|
|
|
Underrepresented Minority
|
-0.002
|
0.099
|
-0.02
|
0.983
|
|
|
Pell Eligible Students
|
-0.113
|
0.094
|
-1.2
|
0.237
|
|
|
Retention Rate
|
-0.026
|
0.083
|
-0.31
|
0.759
|
|
|
Resident Full Time Enrollment
|
-0.323
|
0.136
|
-2.38
|
0.022
|
**
|
|
Graduation Rate at 100%
|
0.185
|
0.108
|
1.72
|
0.094
|
*
|
|
Graduation Rate at 150%
|
-0.086
|
0.085
|
-1.02
|
0.315
|
|
|
West
|
0.311
|
0.061
|
5.13
|
0
|
***
|
|
Uses Credentials of Value STEM
|
0.166
|
0.095
|
1.74
|
0.089
|
*
|
|
c.West##c.UsesCredValueSTEM
|
-0.22
|
0.154
|
-1.42
|
0.162
|
|
|
Constant
|
0.901
|
0.045
|
19.88
|
0
|
***
|
|
|
|
|
|
|
|
|
Mean dependent var
|
0.936
|
SD dependent var
|
0.248
|
|
|
R-squared
|
0.356
|
# of observations
|
50
|
|
|
F-test
|
4.881
|
Prob > F
|
0
|
|
|
Akaike crit. (AIC)
|
1.298
|
Bayesian crit. (BIC)
|
22.33
|
|
|
*** p<.01, ** p<.05, * p<.1
|
|
|
|
|
|
Table 6
How Credentials of Value Production Affect the Economy
This section provides a detailed analysis of CSI’s econometric results. Our methodology used publicly available government workforce and education data to project the economic impact of additional funding toward the credential production input variable in the funding model — assuming credential production only includes credentials that are of high ROI value in the workforce and fall into high-demand, high-growing sectors. Our methodology estimated the direct effect of high-demand/high ROI job increases across five scenarios associated with upticks in credentials of value production statewide.
By exploiting the average annual level of graduates in these fields and utilizing percentage thresholds as a proxy for growth in graduates, our findings suggest significant, positive economic impacts across all of our output variables. Specifically, results suggest significant increases in employment-enhancing productivity as opposed to employment-reducing productivity. Economic outcomes grew tremendously as the magnitude of the percentage thresholds increased.
REMI Results
The economic impact of expanded credentials of value was modeled using two factors:
- Change in direct employment for sectors that would see a bump in productivity-enhancing labor; and
- Change in the labor productivity for impacted sectors. Labor productivity is assumed to be labor-enhancing, meaning more labor intensity, as opposed to labor replacing.
- The direct employment impact from the credentials of value boost occurs in Colorado.
We modeled 5%, 10%, 15%, and 20% increases in the level of graduates with credentials of value and found that a:
- 5% increase led to a 991 rise in direct employment
- 10% increase led to a 1,982 rise in direct employment
- 15% increase led to a 2,973 rise in direct employment
- 20% increase led to a 3,964 rise in direct employment
Regarding labor enhancing labor productivity, we found that a:
- 5% increase in credentials led to a 0.05% rise in direct labor enhancing labor productivity
- 10% increase led to a 0.1% rise in direct labor enhancing labor productivity
- 15% increase led to a 0.15% rise in direct labor enhancing labor productivity
- 20% increase led to a 0.20% rise in direct labor enhancing labor productivity
Scenario 1: 5% Increase
The results of the REMI model are presented in Table 7. Overall; the results suggest a 5% increase in graduates with credentials of value would lead to:
- 4,635 new jobs above the baseline job growth by 2035
- A $1.1 billion increase in nominal GDP by 2035
- A $2.0 billion increase in output by 2035
- A 6,108 increase in population by 2035
- A $767 million increase in personal income by 2035
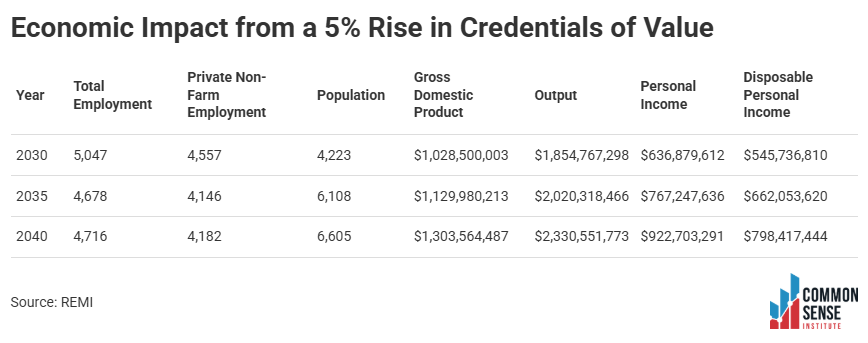
Table 7
Scenario 2: 10% Increase
The results of the REMI model are presented in Table 8 below. Overall, the results suggest a 10% increase in graduates with credentials of value would lead to:
- 9,270 new jobs above the baseline job growth by 2035
- A $2.2 billion increase in nominal GDP by 2035
- A $4.0 billion increase in output by 2035
- A 12,396 increase in population by 2035
- A $1.5 billion increase in personal income by 2035

Table 8
Scenario 3: 15% Increase
The results of the REMI model are presented in Table 9. Overall; the results suggest a 15% increase in graduates with credentials of value would lead to:
- 13,906 new jobs above the baseline job growth by 2035
- A $3.4 billion increase in nominal GDP by 2035
- A $6.0 billion increase in output by 2035
- An 18,598 increase in population by 2035
- A $2.3 billion increase in personal income by 2035
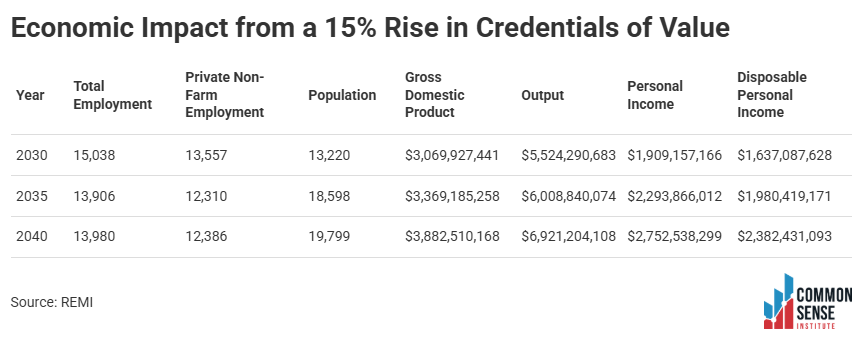
Table 9
Scenario 4: 20% Increase
The results of the REMI model are presented in Table 10. Overall, the results suggest that a 20% increase in graduates with credentials of value would lead to:
- 18,542 new jobs above the baseline job growth by 2035
- A $4.5 billion increase in nominal GDP by 2035
- An $8.0 billion increase in output by 2035
- A 24,804 increase in population by 2035
- A $3.1 billion increase in personal income by 2035
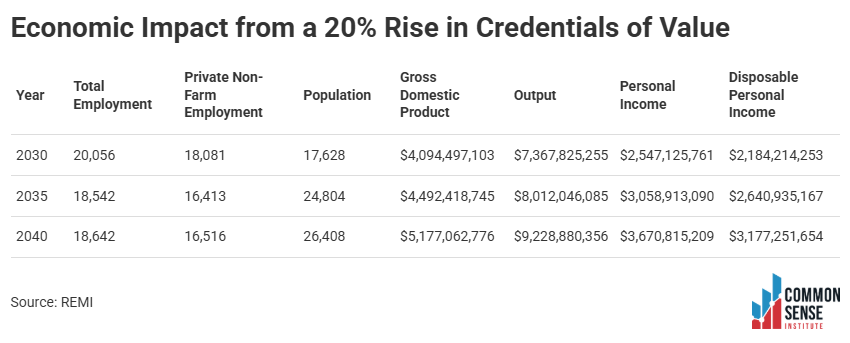
Table 10
Our central findings regarding the importance of credentials of value are best represented in Table 10, or scenario 4. REMI results suggest strong growth relative to the economy’s current state.
Assuming the scenario that boosts the level of graduates by 20% in the state, our estimates show this would lead to nearly 19,000 new jobs in Colorado by 2035, spurred by a highly talented pipeline of graduates. This number is roughly the same capacity as Madison Square Garden.
Regarding population, if the state’s funding formula appropriated 20% of its funding toward credentials of value, CSI’s model estimates a population growth of 24,804 by 2035, a number that exceeds Ball Arena’s capacity by more than 3,000.
Population growth projections are important measurements since previous research has shown this variable has strong correlations with economic growth. These estimated population increases would come at a critical time for Colorado: the State Demography Office (SDO) predicts a decline in statewide fertility rates, lower domestic in-migration, and 40,000 worker retirements by 2030. These factors will have major repercussions for the state’s labor market, which means population growth will be necessary for Colorado’s economy to succeed in the long run.
Recommendations and Further Research
Recommendations
Based on CSI’s findings, policymakers may want to consider:
- Increasing the incentive for institutions to produce credentials of value. The current formula is rigid in nature, and institutions do not lose money if they perform poorly compared to their peers.
- Prioritize targeted expansion of academic programs in underrepresented, high-demand, high ROI fields or direct students to private providers of this type of coursework in order to avoid duplication. This option could strengthen Colorado’s talent pipeline and improve alignment between higher education outputs and labor market demands. While progress has been made in producing graduates in health professions and business-related disciplines, other sectors — such as construction trades, legal professions, physical sciences, social sciences, and biological and biomedical sciences — remain underserved.
- Introduce workforce-aligned incentives tied to program demand, regional labor needs, and credential ROI.
Further Research
The findings and recommendations of this paper lend themselves to further research on the differential impact that states’ funding strategies are having on student outcomes and the economy overall. In this vein, further research that would be helpful to Colorado in advancing its higher education and economic development strategy includes—
- Create a higher education database for funding strategies across states and time, back to at least 2010, to better decipher the causal impact of funding incentives on the state’s job market.
- Create a database of the weights states have placed on underrepresented and low-income students to decipher any potential causal impact between incentivizing institutions to target underrepresented and low-income students and their economic outcomes.
- Create a database of the growing importance of job placement in states’ higher education funding formulas and the causal impact these weights are having on employment outcomes of students.
Bottom Line
While funding for credential production to higher education institutions has spiked over the years in Colorado, data indicates credential generation has decreased marginally, suggesting no correlation between credential funding and credential generation.
Perhaps more importantly, the current funding formula does not adequately consider credentials of value in connection to the state’s labor market and student ROI. By channeling more efforts and funding toward credentials of value production, institutions would have a more significant incentive to ramp up the types of attainment awards offered. CSI findings also suggest this investment would have a rippling effect on graduates’ workforce readiness, economic mobility, and quality of life.
Appendix A
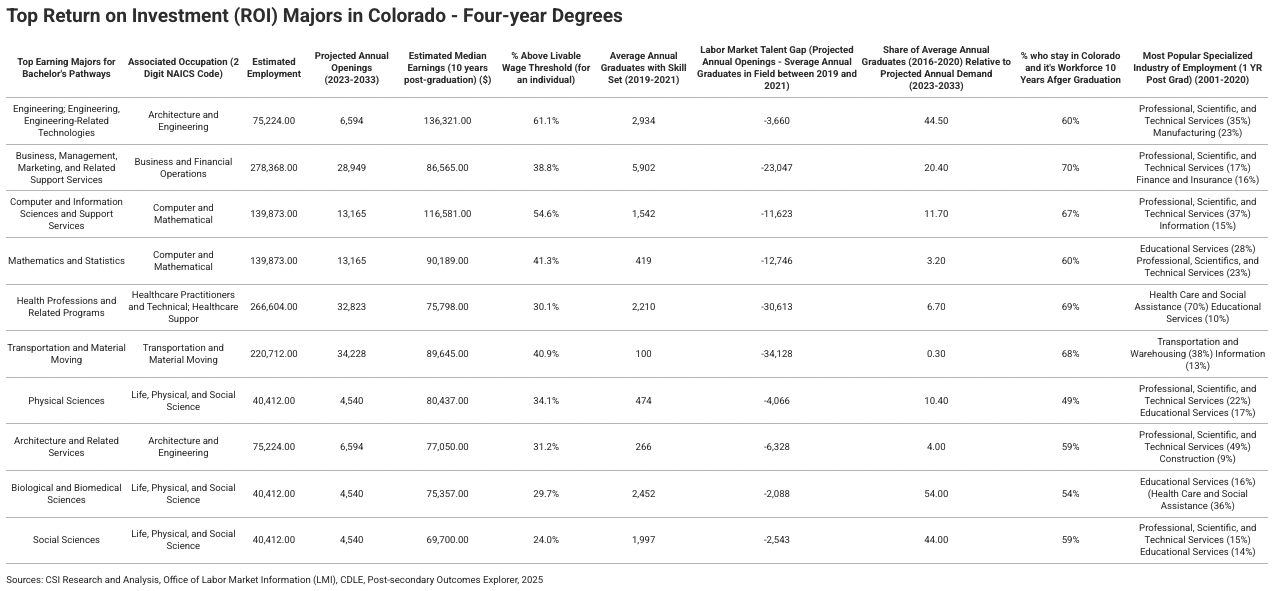
Table 1A
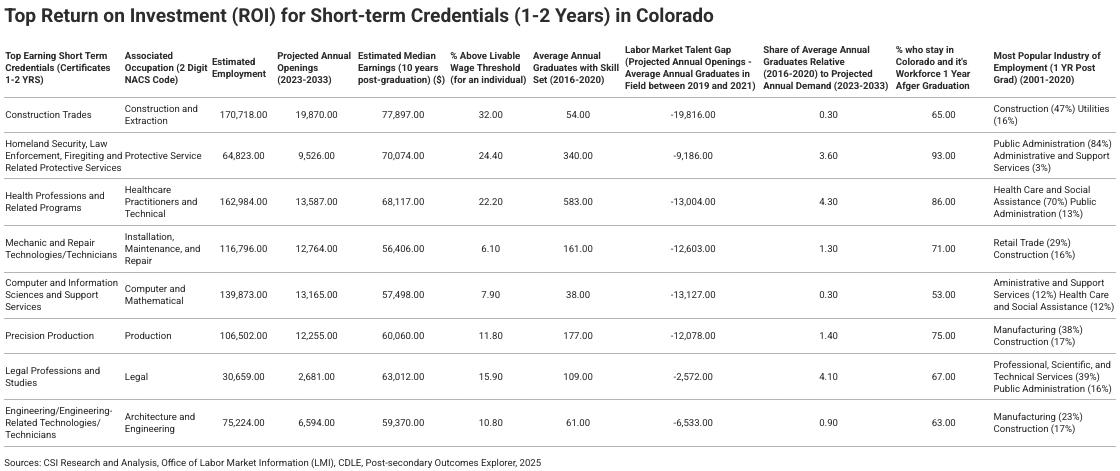
Table 1B
Appendix B
The model results are given in the following table. The model specifications structure is:
|
Structural equation model Number of obs = 50
|
|
|
|
|
|
Estimation method: ml
|
|
|
|
|
|
Log likelihood = -490.20771
|
|
|
|
|
|
( 1) [credential]Institutional_effectiveness = 1
|
|
|
|
|
|
|
|
|
|
|
|
|
|
|
|
|
Standardized
|
Coefficient
|
std. err.
|
z
|
P>z
|
|
Structural
|
|
|
|
|
|
credential
|
|
|
|
|
|
Institutional_effectiveness
|
0.603
|
0.13
|
4.65
|
0
|
|
_cons
|
1.225
|
0.182
|
6.74
|
0
|
|
se_share
|
|
|
|
|
|
credential
|
0.307
|
0.184
|
1.67
|
0.094
|
|
stem_jobs
|
0.342
|
0.126
|
2.71
|
0.007
|
|
Institutional_effectiveness
|
-0.42
|
0.225
|
-1.87
|
0.061
|
|
_cons
|
2.607
|
1.414
|
1.84
|
0.065
|
|
stem_jobs
|
|
|
|
|
|
west
|
-0.002
|
0.19
|
-0.01
|
0.992
|
|
northeast
|
0.2
|
0.16
|
1.25
|
0.21
|
|
south
|
-0.296
|
0.169
|
-1.75
|
0.079
|
|
avg_job_growth
|
0.09
|
0.153
|
0.59
|
0.555
|
|
_cons
|
9.133
|
1.075
|
8.49
|
0
|
|
Measurement
|
|
|
|
|
|
enrollment
|
|
|
|
|
|
Institutional_effectiveness
|
0.159
|
0.168
|
0.95
|
0.343
|
|
_cons
|
0.253
|
0.143
|
1.76
|
0.078
|
|
underrepresented_all
|
|
|
|
|
|
Institutional_effectiveness
|
0.599
|
0.137
|
4.36
|
0
|
|
_cons
|
0.923
|
0.163
|
5.66
|
0
|
|
efficiency
|
|
|
|
|
|
Institutional_effectiveness
|
0.753
|
0.124
|
6.06
|
0
|
|
_cons
|
0.851
|
0.156
|
5.47
|
0
|
|
performance
|
|
|
|
|
|
Institutional_effectiveness
|
0.262
|
0.171
|
1.53
|
0.126
|
|
_cons
|
0.46
|
0.148
|
3.12
|
0.002
|
|
var(e.credential)
|
0.637
|
0.156
|
|
|
|
var(e.enrollment)
|
0.975
|
0.053
|
|
|
|
var(e.underrepresented_all)
|
0.641
|
0.164
|
|
|
|
var(e.efficiency)
|
0.433
|
0.187
|
|
|
|
var(e.performance)
|
0.931
|
0.09
|
|
|
|
var(e.se_share)
|
0.735
|
0.138
|
|
|
|
var(e.stem_jobs)
|
0.828
|
0.093
|
|
|
|
var(Institutional_effectiveness)
|
1
|
.
|
|
|
|
cov(west,Institutional_effectiveness)
|
-0.076
|
0.158
|
-0.48
|
0.629
|
|
cov(northeast,Institutional_effectiveness)
|
-0.416
|
0.134
|
-3.1
|
0.002
|
|
cov(south,Institutional_effectiveness)
|
0.388
|
0.14
|
2.77
|
0.006
|
|
cov(avg_job_growth,Institutional_effectiveness)
|
-0.099
|
0.152
|
-0.65
|
0.515
|
|
|
|
|
|
|
Appendix C
The model results are given in the following table. The model specifications structure is: