Colorado Condos: Is Defects Liability Fixed? Are Insurance Costs Easing? Are Condos Coming Back?
Introduction: Have Condo Defects Been Fixed? Are Insurance Costs Easing? Are Condos Coming Back?
In 2024, CSI published a report examining one of the reasons for the sharp and prolonged decline in condominium construction in Colorado. It is the cost of potential litigation for condominium defects.[1] Builders must prepare for potential litigation by either holding money in escrow or purchasing insurance for the prospect of litigation.
The findings from the 2024 report were clear: while demand for owned housing remained strong, condominium development had nearly vanished, replaced almost entirely by rental unit production. The consequences were not abstract, but visible in lost homeownership opportunities, higher entry prices, constrained household mobility, and a housing continuum where affordable and accessible homeownership opportunities were mostly absent.
These outcomes are reinforced by mortgage-capacity data that showed a growing share of Colorado households retain the ability to finance owned housing, but not at the price points where new supply is being delivered. As CSI’s Colorado’s Housing Affordability Mismatch also demonstrated, our 2023 report showed there is now a structural mismatch that condominiums could help bridge.
In the 2025 legislative session, Colorado lawmakers took a meaningful step toward addressing this long-standing imbalance. With the passage of HB 25-1272, the Construction Defects and Middle Market Housing Act, lawmakers acknowledged what data, builders, insurers, and local governments have long understood: that risk, not demand, has been the binding constraint on condominium production in Colorado.
This report update does not seek to overturn the conclusions of the 2024 report. Nor does it pre-judge the effectiveness of the 2025 reforms before they have had time to fully take effect or make an impact. Rather, it situates Colorado’s new approach in a broader, comparative context, most notably alongside Nevada, a state that has pursued a different path and has seen materially different outcomes in condominium construction.
Key Findings
Colorado’s condominium market remains structurally broken, not demand-constrained.
Condominium production in Colorado has failed to recover for nearly two decades despite strong household mortgage capacity and population growth. If condos had merely maintained their early-2000s relationship to population growth, the Front Range would have produced roughly 80,000 additional condominium units since 2006. Instead, production has collapsed to historic lows, with attached rental units now outpacing condos by about 45 to 1 in 2025.
Litigation risk, and the insurance market response to that risk, remains the binding constraint on condo production.
Condo builder liability insurance in Colorado typically ranges from 4–6% of project hard costs, roughly 4.5 to 5 times the cost of insuring comparable multifamily rental home projects, and well above surrounding states. Fewer than five excess-and-surplus carriers are currently willing to underwrite this risk.
The cost of this risk is borne directly by households through higher prices and lost access to homeownership.
At current prices, only 44% of Colorado households can afford the mortgage on a typical condominium under standard underwriting assumptions. CSI estimates that reducing the insurance costs for condo builders to the level of apartment developers alone would allow approximately 43,000 additional households to afford condo ownership statewide. In effect, today’s liability regime functions as an implicit tax on first-time and middle-income buyers.
Colorado’s limited condo output has increasingly shifted toward higher-income areas.
As overall condo production has declined, the composition of what little is built has skewed upward. The share of new condos delivered in higher-income zip codes has risen from 20% to 28%, while production in lower-income areas has fallen from 4% to 2% over the past 15 years.
Nevada demonstrates that certainty restores condominium production.
Nevada confronted a similar collapse in condo construction but pursued a different policy path: directly constraining litigation risk through clearer defect definitions, mandatory notice-and-repair procedures, limits on HOA aggregation, and reduced attorney-fee leverage. The result has been a measurable return of condominium development, most visibly in Las Vegas, which now ranks among the fastest-growing metro areas for condo sales share nationally.
Colorado’s 2025 reforms represent a meaningful shift, but one that remains conditional and unproven.
HB 25-1272 introduces a voluntary, verification-based framework that trades enhanced inspections and warranties for a more structured defect-resolution process. While symbolically important, the reform leaves the underlying litigation framework largely intact and places the burden of participation on builders. Early insurer feedback suggests skepticism that the program will materially change underwriting behavior.
The economic costs of continued inaction are large, measurable, and ongoing.
If Colorado were to normalize condo insurance costs and restore production to historical levels, CSI modeling suggests gains of 3,200–6,300 jobs, $4 billion in GDP, and nearly $3 billion in personal income over five years. Continued stagnation represents a persistent drag on economic growth and household opportunity.
The Backdrop: Where Did All the Condos Go?
Condos, which have long been considered a steppingstone to the broader goal of homeownership, have had an exceptionally weak 17 years. Since peaking at 1,497 quarterly units in the second quarter (Q2) of 2005 for the 11 largest counties covered by Zonda, condo construction has consistently been less than half that level. The most recent accounting estimated from data published by Zonda found fewer than 400 condo units were built in 2025. Of the estimated 31,995 condo starts from Q1 2002 through Q4 2025 across the Front Range, approximately half were built in the four years between 2002 and 2005 (Figure 1).
Figure 1:
Why has there been such a precipitous drop in condominium starts? Is there a lack of demand or are costs simply too high compared to competing alternatives?
As an estimate of the magnitude of the issue, if condo starts had simply stayed at 8% of population growth as they did from 2002 to 2004, condo starts would have been almost 96,000 since 2006
across the 11 Front Range counties, much larger than the 16,000 that were actually built (Figure 2).
When looking at new condos as a share of the annual population growth for the 11 counties identified above, the comparison is even more stark. The number peaked in 2005 at 10.4% with almost 5,000 condos and just over 47,000 new residents. Since then, it has precipitously declined with CSI estimating a decline to 1.5% in 2025 — 367 condo units compared with more than 24,000 new residents. (see Figure 2).
Figure 2:
Starts of Attached Homes from 2002 through 2025
The decline in condominium units has coincided with a rise in rental units. For a brief period from 2004 through 2008, condo units surpassed attached rental units. Since then, rental units have far exceeded condo units by large magnitudes (Figure 3).
Figure 3:
The rise in rental units began after Q4 2011 when the number of attached rental units, at 629, was quite small by today’s rental unit permit rates. In contrast to the rise in rental units, condominium production peaked in Q4 2006 at just over 4,000 (an annualized rate above 16,000), a level that condo developers have never come close to reaching again. Through 2025, condo permits across the 8-county Denver metro area shown in Figure 3 were a little over 1,000.
When looking at the annual trends in permitting for attached rental units compared to condo units, the difference is enormous. In 2025, CSI estimates that attached rental units will exceed new condominium units by about 45 fold, meaning that it would take 45 years of the 2025 condo construction level to equal the 2025 attached rental unit construction (Figure 4).
Figure 4:
The Number of Condo Builders
The number of condo builders has consistently declined since 2007. In 2007, there were 146 condominium developers in the Metro Denver area. By 2025, the number of condominium developers had dropped to just 13, a drop of 91% over approximately 20 years.
Figure 5:
Denver’s Share of National Condo Sales
How have Denver condo sales by year built performed relative to the nation as a share of the country as a whole? Figure 7 has that comparison. In total, Denver’s share of condos built in 2025 was incredibly low. As of the most recent 2025 data, condo sales in the Denver area accounted for just 0.68% of nationwide 2025 condo sales even though Denver’s population accounts for more than 1% of the population for the 466 cities reported by ParclLabs. Other cities saw their share of condo sales rise. As shown in Figure 8, cities that have seen condo sales boom since 2010—relative to other cities—include Jacksonville, Portland (OR), Fort Worth, Boston, Charlotte, Houston, El Paso, San Antonio, Las Vegas, and Dallas. All of these cities saw their share of condo sales grow by more than 1%. Over the same period, Denver was in the bottom 20 of 466 cities—ranked 448—down from 1.3% to 0.7%. For a timeline picture of recent national trends in condo construction, see Appendix E.
Figure 6:
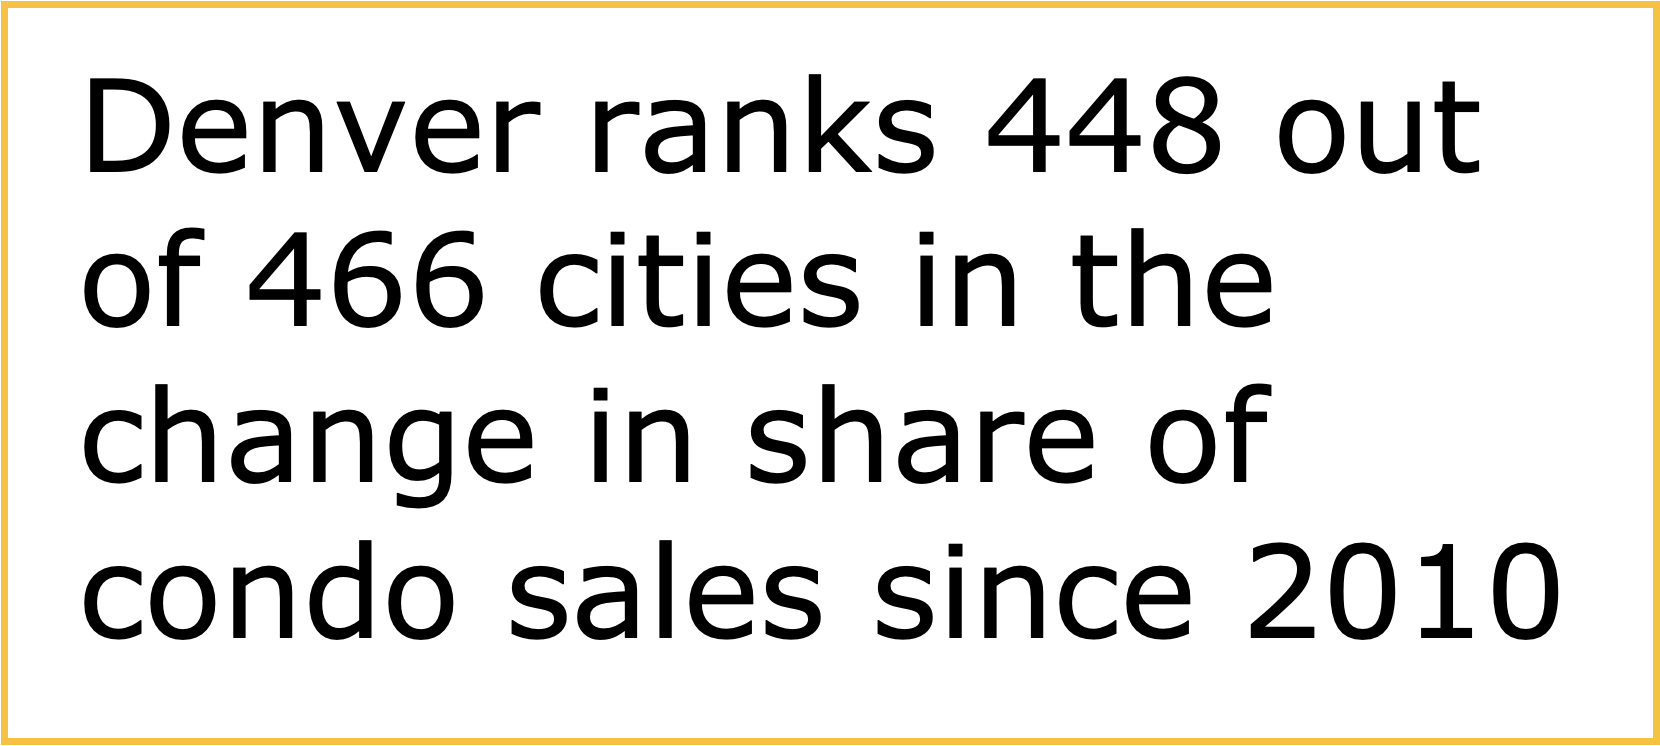
Figure 7:
What is causing the drop in condo sales in Denver relative to the nation? Among the reasons for the lack of condo construction in Denver are:
- Higher than average per-unit costs[i],[ii]; and
- The litigation/insurance overhang.[iii],[iv]
Condo Builder Insurance Liability
Why is condo builder insurance so important? Condo builder liability insurance matters because it prices (and sometimes enables) the risk that a builder, general contractor, or subcontractor will be pulled into construction-defect litigation years after completion—often via HOA claims over building-envelope, water-intrusion, and common-element issues. When that risk environment is high or unpredictable, carriers respond with higher premiums, larger deductibles/self-insured retentions, narrower coverage, tougher underwriting, and “wrap”/project-specific policies that can be multiples of standard general-liability coverage. These costs get baked into the condo pro forma and ultimately the unit sale price.[2] In Colorado’s case, liability insurance can make it so that the project doesn’t pencil and makes apartments a more attractive, financially feasible alternative instead. In other words, insurance isn’t just another line item increasing the cost of the project; it can be a gating constraint on financing, subcontractor participation, and whether a developer will attempt an attached-for-sale product at all, because lenders and equity typically require evidence that the project’s liability tail is insurable on acceptable terms.
States that want more condo supply have generally tried to keep consumer protections while making claims more specific, more pre-litigation/resolution-oriented, and less “all-or-nothing.” Washington, for example, has repeatedly revised its condo warranty/liability framework starting with 2019 changes (SB 5334) aimed at dialing back overly broad implied-warranty exposure and related litigation dynamics. Other states have leaned on governance/process reforms: Minnesota added requirements like enhanced owner notice before an association brings a suit (and related procedural guardrails), and Nevada has used Chapter 40 reforms (including pre-litigation steps and limits around association claims) to steer disputes toward earlier resolution and narrower, better-defined scopes.
The Colorado Insurance Market for Condo Builders
To gauge the condo builder insurance market in the state, CSI reached out to providers of insurance for condo builders. The comments CSI received back illuminate exactly how concentrated and extremely risk-averse Colorado’s condominium liability market remains. A January 2026 market update from IMA, an insurance advisory firm active in the construction sector, noted that[v]:
- Fewer than five excess-and-surplus carriers for condo builders are currently willing to underwrite condominium liability risk in the state.
- They typically insure through Owner Controlled Insurance Programs (OCIPs). Premiums for those policies range from 4-6% of project hard costs.
- Increasingly, defense expenses are an important driver of high insurance costs, especially under policies where defense costs erode the policy limit. For example, if a builder has a $10 million liability limit and incurs $4 million in defense costs, only $6 million remains available to pay claimants. As defense costs continue to rise, the likelihood increases that a condo builder will face out-of-pocket exposure for plaintiffs’ claims that exceed the remaining policy limits.
- The same update reflected widespread insurer skepticism that HB 25-1272 will materially alter underwriting behavior absent demonstrated loss reduction over time.
Condo Builder Insurance Rates Across Surrounding States
As mentioned, the high cost of condo builder insurance liability not only increases the cost to purchase a condo in the state but is also acting as an incentive not to build condos. As a comparison, the following figures compare the insurance rates faced by condo builders in surrounding states. Overall, Colorado and Arizona condo builders face the highest costs for condo projects. Colorado’s is typically the highest at 5%-5.5%, followed by Arizona’s at between 2%-4%. Other surrounding states—Utah, Wyoming, Nebraska, Kansas, New Mexico—face rates substantially lower in the typical 1%-2% range.
Figure 8:
How Does High Insurance Costs and Missing Condos Impact the Broader Economy?
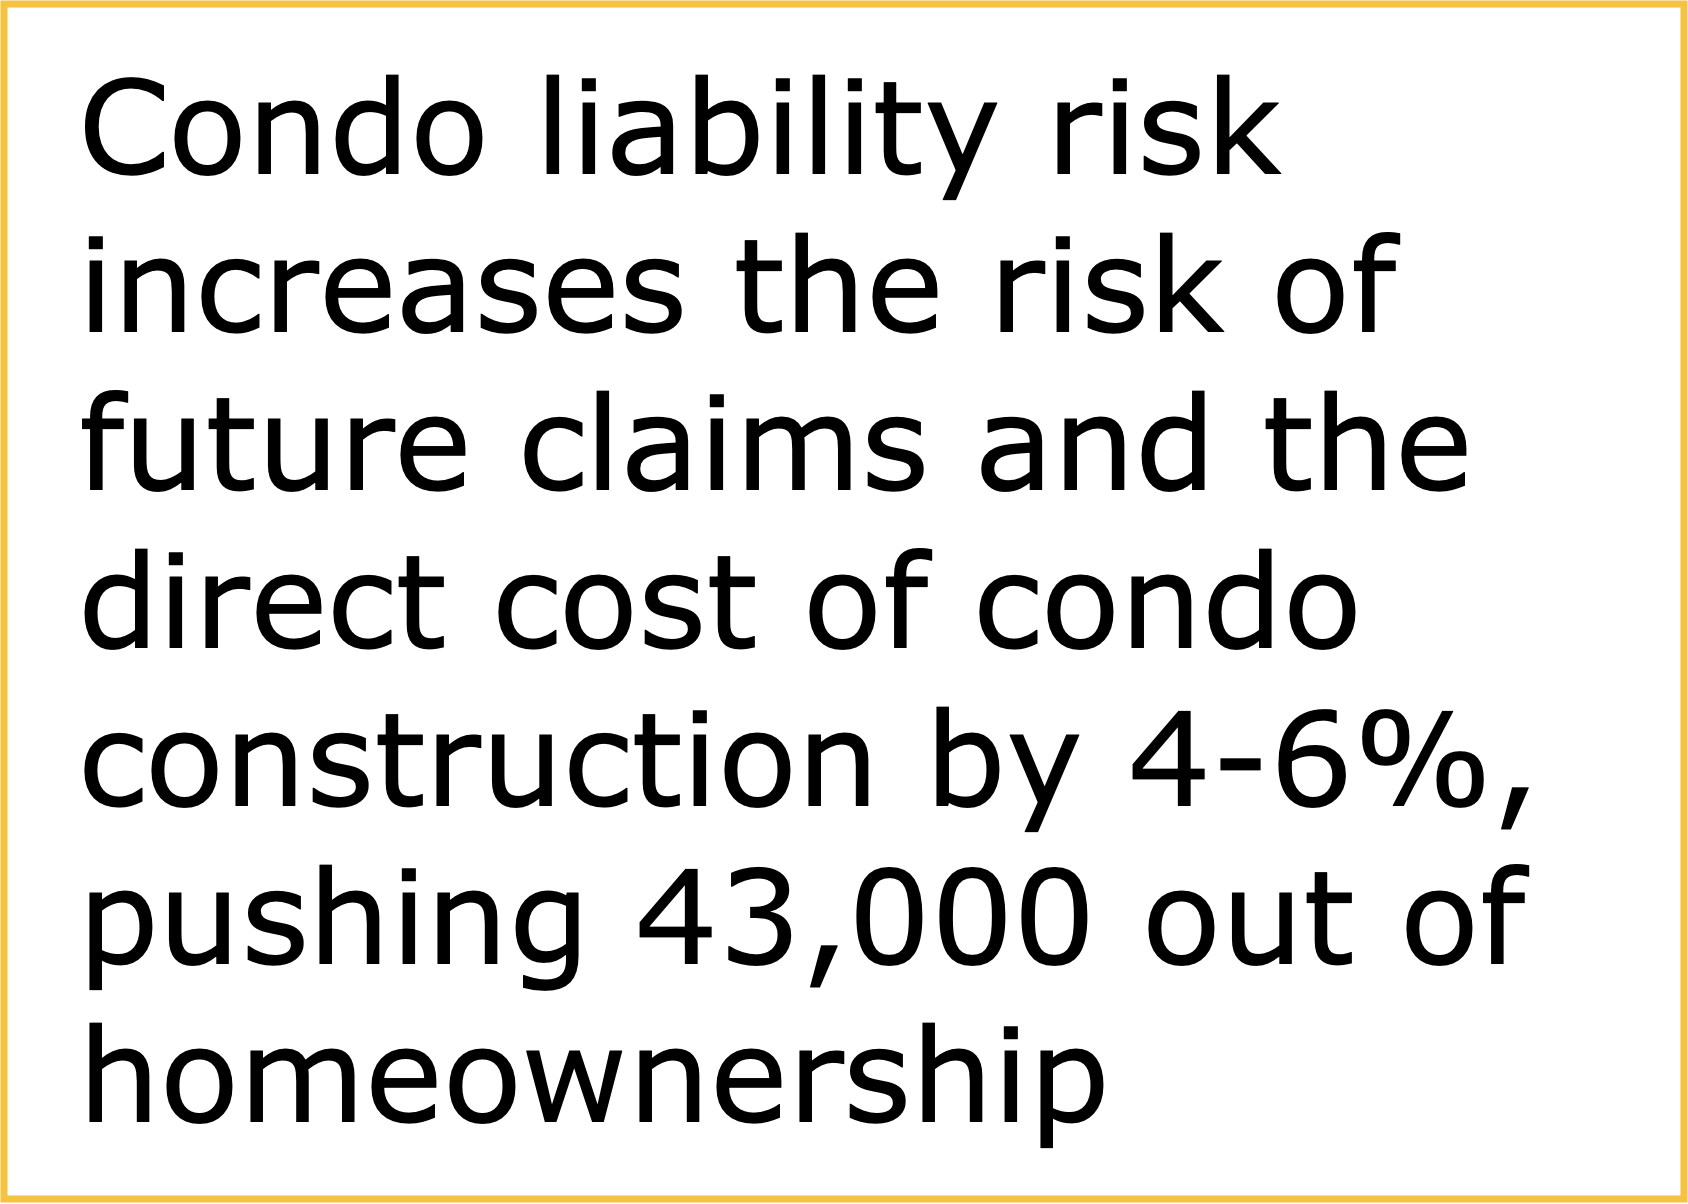
As CSI previously noted, condo builders face high insurance costs for condo development, with the typical cost of 4%-6% of the project’s hard cost.[vi] This cost shows up in a higher final price to the new owner and/or missing condos, contributing to the difficulty in offering affordable condos.
To model the economic impact, CSI employed REMI Tax PI+ to estimate the dynamic economic impact of higher developer insurance costs of 3% in the state (5.5% for Colorado minus 2.5% for an assumed average across states[vii]).[3] By bringing condo costs down, Colorado would likely see condos make a comeback, particularly of the less expensive type. The boost to the economy overall is reported in the following Figure 10. Appendix B has more detail on the modeling methodology.
Overall, if Colorado were able to lower the condo developer insurance costs to the national average and create greater certainty in long-term legal liability akin to other states, the economy benefits. By having high condo developer insurance and long-term risk of claims, the state is missing out on jobs and economic growth by discouraging the development of condos. The economic benefits of long-term reliability in liability risk and non-high insurance costs are broad, including:
- Between 3,200 and 6,300 jobs from 2026 to 2030—equal to 21% of Colorado’s job growth last year.[viii]
- $4 billion in GDP—almost enough to cover the entire General Fund portion of the education budget.[ix]
- $7 billion in business sales—or more than virtually all private companies in the state.[x]
- Almost $3 billion in personal income—enough to send each household in the state a $1,000.
Figure 9:

Expensive Condo Insurance Is Pushing Households Out of Homeownership
With the median sale price of a Denver condo at $395,000, condos are no longer an entry-level option for wealth generation.[xi],[xii] Question: How many people are missing out on condo ownership because of higher than average builder insurance liability?
Using the 28% rule, which states that no more than 28% of a household’s gross income should be spent on housing, the share of households that can afford the typical mortgage payment for a condo is 44%, or around 1.1 million households.[xiii],[4] This deficit leaves approximately 1.4 million households unable to make the monthly mortgage payments for a condo without going over the 28% rule.
How many additional households would be able to afford a condo using the 28% rule if the builder risk insurance were reduced to the level of apartments (e.g., dropping 4%)? Lowering this risk would lower the monthly mortgage payment from $2,540 to $2,439. CSI estimates that shift would result in an additional 43,000 households being able to afford the average mortgage payment, bringing the total households able to afford this cost from 1,090,000 households to 1,133,000 households. As the old adage goes—every little bit matters—and in the case of condo builder liability insurance, that little bit equates to 43,000 fewer homeowners in the state.
Figure 10:

Mapping Condo Sales and the Lack of Affordable Condos
To further gauge the state of the condo market—in particular what type of condos are being built in the state—CSI reviewed data captured by real estate intelligence firm ParclLabs and connected it with median household income for the area, as defined by zip code boundaries. Appendix C has a map of all the condo sales considered. Appendix D has information on how the sales of condos have changed across time.
The bottom line is this: Over the past 15 years, the Denver area condo market—be it greatly diminished in building activity—has shifted. The shift has been away from condos in less affluent areas (lower and mid-range income areas) to more affluent areas.
Figure 11:

A Case Study in Comparison: Colorado and Nevada
Colorado and Nevada confronted a similar challenge: condominium construction stalled under the weight of litigation risk, insurance withdrawal, and escalating uncertainty. Where they diverged was not in diagnosis, but in treatment. The treatment, of course, affected the availability and viability of condominium homeownership for buyers.
Nevada: Certainty First
Nevada’s construction defect reforms, adopted primarily between 2015 and 2019, were designed to directly constrain litigation risk. The state narrowed the statutory definition of a construction defect, strengthened mandatory notice-and-repair procedures, limited the aggregation of claims through homeowners associations, and removed automatic entitlements to attorney fees. In doing so, Nevada shifted the system decisively toward early resolution and repair, while reducing the leverage that had previously driven large, association-wide lawsuits.
The result has been a measurable return of condominium development, particularly in the Las Vegas market. Builders re-entered the space, insurers adjusted pricing and availability, and capital followed. For prospective buyers, this movement translated into a concrete outcome: condominiums that could once again be financed, insured, built, and sold.
As evidence for the effect Nevada’s reforms had, consider the following comparison of the growth or decline in the share of condos built nationwide. Shown in Figure 12 is the top 10 cities for growth in their share of condo sales of 466 covered by real estate data aggregator ParclLabs. Coming in ninth highest is Las Vegas, Nevada, with its share up to 1.6% in 2025 from virtually nothing in 2010. Nevada’s approach to limiting potential liability for condo builders had an effect on the rise of Las Vegas.
Figure 12:
Notably, Nevada’s reforms did not eliminate disputes, but narrowed and stabilized them. That predictability is what housing markets require for builders to re-enter the condominium segment, particularly at price points the median Coloradan can afford.
Nevada’s framework places higher thresholds on claims and narrows the circumstances under which homeowners and associations can litigate. It prioritizes production and certainty. That choice was deliberate, and it has produced results in the form of renewed access to condominium homeownership for Nevadans.
Colorado: Caution and Verification
Colorado’s 2025 reforms took a different approach. Rather than constraining claims, HB 25-1272 introduced a voluntary pathway, the Multifamily Construction Incentive Program, that exchanged heightened quality assurance for greater predictability in defect resolution.
Builders who opt into this new system must provide minimum warranties, submit to third-party inspections throughout construction, and make those commitments transparent to buyers. In return, participating projects operate under a more structured litigation environment that emphasizes repair, reasonableness, and mitigation. The legislation also raised the threshold for HOA-initiated litigation and reinforced the principle that recoveries should be used first to fix buildings, not simply extract damages.
The tradeoff is time and uncertainty. Because the program is voluntary and prospective, its success will depend on whether insurers, lenders, and builders ultimately treat participation as a meaningful reduction in risk. That determination will not be made in statute, but in underwriting rooms, and its implications will be felt most directly by future condo home buyers. Early feedback from both builders and insurers indicates a high degree of skepticism that the program will materially alter risk pricing or availability, though time will ultimately determine its effectiveness for all stakeholders.
Why Nevada Is Functionally More Condo Home Buyer–Friendly: A Structural Comparison
The following table provides a comparison of Colorado’s and Nevada’s approaches. It focuses not on the interests of builders as an end in themselves, but on how each framework affects the availability, insurability, affordability, and long-term viability of condominium homeownership for buyers. In practice, these outcomes are shaped by how risk is allocated, constrained, or conditioned within each system.
This comparison draws on Nevada’s construction defect reform history and outcomes as documented in the Nevada Construction Defect Reform (April 2025), which summarizes legislative changes to Chapter 40 and associated housing and litigation trends.
Table 1:
|
Dimension
|
Nevada
|
Colorado (HB25-1272)
|
|
How protections apply
|
Applies universally to residential construction
|
Applies only if a builder opts in to the Multifamily Construction Incentive Program
|
|
Treatment of defect claims
|
Narrows what qualifies as a construction defect
|
Baseline defect framework largely unchanged outside the program
|
|
Attorney fee leverage
|
Removes automatic statutory attorney-fee entitlement
|
Retains fee leverage; relies on discretionary fee-shifting standards
|
|
Litigation posture by default
|
Constrains claims directly and system-wide
|
Preserves existing litigation dynamics unless the builder fully participates
|
|
Repair pathway
|
Mandatory, streamlined pre-litigation notice and opportunity to repair
|
Repair-first structure emphasized, but enhanced predictability applies mainly to program claims
|
|
Claim aggregation (HOAs)
|
Limits aggregation tactics and narrows standing
|
Raises HOA approval threshold (65%) but preserves aggregation authority
|
|
Compliance burden
|
Relatively lean: notice then inspection and repair; litigation only if needed
|
Complex: warranties, third-party inspections, certifications, disclosures, tolling, dual regimes
|
|
Administrative cost
|
Lower, more predictable
|
Higher upfront and ongoing compliance costs
|
|
Risk signal to insurers
|
Clear reduction in downside litigation risk
|
Conditional and untested; home builders, inspectors and insurers must accept the bargain
|
|
Observed market response
|
Condo production has materially returned
|
Market response remains uncertain; reforms take effect in 2026
|
Nevada has reduced downside litigation risk in ways that make condominium homes more likely to be financed, insured, built, and, when necessary repaired. These conditions ultimately determine whether buyers can access attainable housing offerings. Colorado has offered a more conditional pathway, preserving broader homeowner protections while testing whether verified quality and repair-first processes can achieve similar outcomes over time.
Going Forward: What the Next Three to Five Years Will Tell Us
Nevada’s framework has, to date, been generally successful at restoring condominium construction and, by extension, access to condominium homeownership. The evidence is visible in construction starts, condos sold, insurance participation, and market behavior. Nevada chose greater clarity, the market responded and Nevadan homebuyers are the beneficiaries.
While not as substantial in its reforms, Colorado’s HB 25-1272 represents a historic and symbolic shift. For the first time in many years, lawmakers acknowledged the issue of condo defect risk and missing construction.
At the same time, it would be unrealistic to expect immediate results. Colorado’s reforms are incremental by design. They aim to test whether quality verification, warranty coverage, and repair-first processes can substitute for broader litigation constraints. That hypothesis is reasonable, but it remains just a guess, and a riskier one when measured against Nevada’s demonstrated outcomes.
Over the next three to five years, the effectiveness of the 2025 reforms will be revealed not by the bill's intent, but by outcomes. Several observable indicators will determine whether HB 25-1272 meaningfully alters the condominium market. Chief among these indicators is program participation: whether builders of eligible condominium and townhome projects elect to opt into the Multifamily Construction Incentive Program at meaningful rates. Low participation would suggest the program’s compliance costs outweigh its perceived risk-reduction benefits.
Equally important will be insurer response and pricing behavior. The success of the program depends on whether insurers materially adjust coverage availability, deductibles, exclusions, or pricing for participating projects. Without a meaningful shift in underwriting terms, downstream impacts on feasibility and pricing are unlikely. Closely related is lender behavior, or whether financial institutions treat program participation as a credible signal of reduced risk by adjusting financing terms, reserve requirements, or their willingness to lend on for-sale multifamily product.
Notably, HB 25-1272 does not include a statutory reporting or evaluation mandate to the General Assembly. As a result, there is no automatic mechanism for lawmakers to receive structured, periodic data on program participation, insurer response, litigation trends, or changes in condominium production. In the absence of such a requirement, monitoring the success or limitations of the reforms will depend on externally assembled data, administrative transparency, and voluntary market signals. This accountability gap should be addressed if the state intends to evaluate and refine the framework over time.
Market outcomes will ultimately be reflected in condominium permits and starts, particularly relative to rental multifamily construction in Colorado markets where demand for mortgage capacity aligned housing product offerings remains strong. Just as important, however, is whether any reduction in insurance or litigation-related costs is ultimately reflected in buyer pricing and affordability, helping to restore condominiums as a viable entry point to homeownership.
Assessing defect claims frequency and resolution will be more challenging. Comprehensive and timely data regarding construction defect claims is limited and often lags. As a result, evaluation will necessarily rely on observable proxies rather than litigation counts alone. These proxies include trends in pre-litigation repair activity, warranty utilization, insurer loss experience disclosures where available, and qualitative feedback from insurers, builders, and associations regarding dispute frequency, severity, and resolution pathways for participating versus non-participating projects.
Finally, policymakers should pay attention to local government administrative behaviors, particularly where local review processes intersect with third-party inspection and certification regimes, as well as broader market confidence signals from builders, insurers, inspectors, and lenders. Often, willingness to re-enter or expand activity in the condominium market appears in qualitative signals before it shows up in construction data.
Colorado lawmakers may want to allow the 2025 reforms time to reveal themselves while committing to clear and consistent evaluation. If participation proves limited, if insurers do not materially adjust pricing or availability, and if condominium production remains stagnant, the appropriate response should be swift acknowledgement, followed by action toward a Colorado-specific evolution of the Nevada paradigm.
Bottom Line
Colorado’s construction defect landscape continues to be a discussion point for potential development projects, particularly condos. With the major implementation changes of 2025’s HB 25-1272 just taking effect on January 1, 2026, it is too early to tell if those changes will make any material difference in condo construction. Colorado may continue to be viewed as more plaintiff-friendly than many peer states, particularly those states with longer-standing and more restrictive right-to-repair statutes. The ultimate effect of the 2025 reforms will depend on how frequently builders opt into the incentive program and how courts interpret and apply the new procedural requirements. Over time, these changes may modestly improve the feasibility of for-sale condominium development, but they do not fundamentally remove the threat of construction defect litigation from Colorado’s housing landscape. Based upon comments received from condo builders and insurers, insurance rates are not likely to come down anytime soon.
Appendix A: Comparison Across States
States differ in the details on how they deal with defects in condominium development. For instance, many other states have adopted more rigid statutory “right-to-repair” regimes that strongly channel disputes into pre-litigation repair processes. For example:
- California’s Right to Repair Act establishes detailed statutory standards and mandatory pre-litigation procedures before homeowners may sue.
- Arizona’s Purchaser Dwelling Act requires formal notice and an opportunity to repair before a dwelling action may proceed.
Colorado has historically relied more on notice requirements combined with judicially developed doctrines, rather than a single comprehensive repair statute. The following table provides a comparison of selected states’ policies. Again, it is difficult to tell from just a simple comparison of the time period for discovery limitation, the limitation on repose, the availability of right-to-repair, the process for an HOA to initiate a case, and the general litigation climate.
Table 2:
|
State
|
Limitations (Discovery)
|
Repose (From Completion)
|
Right-to-Repair / Notice
|
HOA Litigation Controls
|
Litigation Climate
|
|
Colorado
|
2 years
|
6 yrs (up to 8 if discovered late)
|
Yes (CDARA notice & cure)
|
65% owner approval (newer law)
|
Plaintiff-friendly
|
|
California
|
4 yrs (patent) / 10 yrs (latent)
|
10 years
|
Very detailed SB 800
|
HOA board authority
|
Plaintiff-friendly
|
|
Arizona
|
2 yrs
|
8 yrs (9 if discovered late)
|
Yes (Purchaser Dwelling Act)
|
HOA board authority
|
Moderate
|
|
Nevada
|
4 yrs
|
6 yrs
|
Strict notice & repair
|
HOA board authority
|
Moderate
|
|
Utah
|
2 yrs
|
9 yrs
|
Limited notice
|
HOA board authority
|
Moderate
|
|
Texas
|
2 yrs
|
10 yrs
|
Strong right-to-repair
|
HOA board authority
|
Builder-friendly
|
|
Florida
|
4 yrs
|
10 yrs
|
Yes (Chapter 558)
|
HOA board authority
|
Moderate
|
|
Washington
|
2 yrs
|
6 yrs
|
Yes
|
HOA board authority
|
Plaintiff-friendly
|
|
Oregon
|
2 yrs
|
10 yrs
|
Yes
|
HOA board authority
|
Plaintiff-friendly
|
|
Idaho
|
2 yrs
|
10 yrs
|
Yes
|
HOA board authority
|
Builder-friendly
|
|
Montana
|
8 yrs
|
10 yrs
|
Limited
|
HOA board authority
|
Moderate
|
|
Wyoming
|
10 yrs
|
10 yrs
|
Minimal
|
HOA board authority
|
Builder-friendly
|
|
New York
|
3 yrs
|
No true repose (case-law based)
|
Minimal
|
HOA board authority
|
Plaintiff-friendly
|
|
Illinois
|
4 yrs
|
10 yrs
|
Limited
|
HOA board authority
|
Moderate
|
|
Minnesota
|
2 yrs
|
10 yrs
|
Yes
|
HOA board authority
|
Moderate
|
|
North Carolina
|
3 yrs
|
6 yrs
|
Yes
|
HOA board authority
|
Moderate
|
|
Georgia
|
4 yrs
|
8 yrs
|
Limited
|
HOA board authority
|
Moderate
|
|
Virginia
|
5 yrs
|
5 yrs
|
Limited
|
HOA board authority
|
Builder-friendly
|
|
Pennsylvania
|
2 yrs
|
12 yrs
|
Minimal
|
HOA board authority
|
Plaintiff-friendly
|
Appendix B: Modeling Methodology
To model the economic impact of lower insurance costs and boosted condo production, CSI employed two assumptions within the REMI modeling system.
- First, CSI employed a lower cost of construction for condos of 3% over the period 2026 through 2030 using a forecast of expected condo construction for the coming five years for the 11 counties mentioned in the body of the report. REMI treats these lower insurance costs as making the state’s housing market more competitive and thereby boosts economic activity. The 3% was modeled as lower taxes for new residential construction for an additional 1,600 annual units at a construction cost of $350,000.
- Second, in addition to the lower insurance costs for condo developers, the model assumes that a more certain liability environment would boost condo construction to 8% of expected population growth, or $560 million annually for 1,600 annual new units costing $350,000 to construct.
Appendix C: Map of Condo Sales
The following map depicts the condo sales considered in the analysis on connecting condo sales volume by the median household income for the area, as defined by zip code.
Appendix D: Condo Sales and Median Household Income
The following summary table captures the shift. The share of condos built in upper income areas (zip codes) is up from 20% in the 2010 to 2017 period to 28% today. The share of condos built in lower income areas has gone from 4% (2010 to 2017 period) to 2% (2024 onward).
Figure 13:
Three scatterplot figures follow. The three figures cover different periods of the year built for condo sales. The first is for condos built between 2010 and 2017. On the horizontal axis is the median household income for the zip code. On the vertical axis is the number of sales captured by ParclLabs. The downward sloping regression line is a way of measuring the relationship. The downward slope means that as one moves to more affluent areas, the likelihood of seeing condo sales declines—essentially meaning that condo sales were more likely to be found is less affluent areas. Remember, this is for the 2010 to 2017 period.
Now, go to the second figure (Figure 15). Notice how the slope of the diagonal line has changed. Instead of sloping downward, the line slopes marginally upwards. What does this mean? It means that an increasing share of new condos were being built in more affluent areas of the Denver area. The desirability of building condos in less affluent areas of the city had declined.
Lastly, fast forward to the third figure (Figure 16), which covers the period from 2024 onward. Notice that the diagonal line become in more upward sloping than in the 2018 to 2023 period. What does this mean? This means that an even more increasing share of new condo sales were built in more affluent areas.
Figure 15:
Figure 16:
Appendix E: Trends in Condo Sales Across the Nation – Denver’s Share is Down to 0.68%
Condo construction has fallen across the United States. As Figure 6 shows, condo sales peaked nationwide in 2006—right before the housing market-induced global financial crisis, sometimes referred to as the Great Recession. It’s unsurprising that condo sales were booming right before the Great Recession—housing sales—and prices—across all types saw their prices appreciate much more than what income suggests they should have. When the housing market burst, so did condo sales. Condo sales precipitously declined after the peak to a bottom of about 19,000 in 2011. After bottoming, condo sales recovered marginally from 2012 through 2018, after which new condos sales continued to decline to about 10,000 for condos built in 2025.
Figure 17:
[v] Institute of Market Analysis, IMA Commentary, February 24, 2025.
[vi] Common Sense Institute, “The Decline of Condominium Construction in Colorado: Addressing Litigation Reform to Alleviate the Housing Affordability Crisis,” accessed March 18, 2026, https://www.commonsenseinstituteus.org/colorado/research/housing-and-our-community/the-decline-of-condominium-construction-in-colorado-addressing-litigation-reform-to-alleviate-the-housing-affordability-crisis
[xii] Colorado Association of Realtors, Market Trends and Housing Data, accessed March 18, 2026.
[1] As a definition, a construction defect is any element of a structure that fails to: (1) perform as intended, or (2) conform to the contract requirements.
[2] A pro forma contains descriptions and financial projections for potential investors in projects, herein condo projects.
[3] Since Colorado already has higher condo builder insurance costs, the 2.5% differential was entered as a negative in REMI—meaning that if Colorado were able to reduce the insurance liability costs for builders by 2.5%, it would be a reduction in overall cost of building condos. By modeling the impact this way, the economic impact result is essentially the situation down to the estimated national average, which makes it more likely for Colorado to condos make a comeback and for less expensive condos to be built.
[4] This calculation assumes a 20% downpayment at a 6.1% 30-year mortgage rate with additional costs for PMI, property tax, and home insurance.