Key Findings
- FY27 will be the first fiscal year with an ending surplus below $1 billion since 2020. The surplus carryforward is projected to fall 42.7% to $870 million.
- In FY27 the state will run an estimated $1.2 billion general-fund deficit, as policymakers return prior surpluses to Iowans through income-tax cuts. To cover the deficit, the Taxpayer Relief Fund is projected to decline from its $4 billion peak in 2025 to roughly $2.6 billion by the end of FY27.
- In FY27, Iowa's total appropriations reached $11.3 billion. The General Fund made up 85.7% of the total at $9.65 billion, with the remaining $1.61 billion drawn from other appropriated funds. Total appropriations grew $109 million, or 1.0%, from FY26—down from the 6.1% increase the year before.
- Adjusted for inflation and population growth, total state appropriations per Iowan are $3,438 and have risen 14.5% since FY00—but are set to fall 1.0% from FY26 to FY27. General-fund spending per Iowan is up 9.7% since FY00, while appropriated non-general funds have grown 55.1%.
- Education drove FY27 general-fund growth, capturing 90.0% of all newly appropriated general-fund dollars. Corrections was the next-largest contributor in FY27, at 4.3%.
- Education and Health Services will comprise 77.8% of all general fund appropriations in FY27. This is up from 77.6% (+0.2%) in FY26, 69% (+8.8%) in FY10, and 56.1% (+21.7%) in FY00.
Methodology
The findings of this report are generated using data from the Iowa Department of Management and annual appropriations reports compiled by Iowa’s Legislative Services Agency. These reports draw from the state's budget packages, which are drafted by the Governor's office then revised and approved during each year's legislative session. They include appropriations to each of the state government's departments from all funds including the General Fund, Cash Funds, Federal Funds, and other miscellaneous Funds. This report categorizes various government agencies into general subject areas to give readers a broad view of the state’s budget priorities.
General Funds: General purpose revenue is deposited into the General Fund and used for the state’s core programs such as education, health care, human services, corrections, and general government (e.g., the legislature and Governor’s office). General Fund revenue is typically sourced through various taxes and fees.
Appropriated Funds are funds subject to legislative appropriation. The general fund is the largest appropriated fund, however the legislature also appropriates money from various other funds for specific purposes such as transportation and the environment.
Federal Funds are moneys received from the federal government to support specific purposes and programs. Though the state spends this money, Congress rather than the state legislature appropriates the funds; the state legislature has little or no control over them. However, Congress delegates authority to the legislature to allocate some federal funds, particularly federal grant dollars, at legislators’ discretion in the annual state budget. This report does not address these funds due to data limitations at the time of release.
The Cash Reserve Fund and Economic Emergency Fund are special-purpose funds funded from general fund surpluses. The cash fund acts similarly to a rainy-day fund, providing financial assistance in times of revenue shortfall or budgetary pressures. The emergency fund addresses more extreme financial crises, such as natural disasters, economic recessions, etc. State statute allows the legislature to allocate only 7.5% of the total surplus to the state’s cash fund and 2.5% to its emergency funds.
The Taxpayer Relief Fund exists to offset revenue losses from tax cuts if necessary to prevent state budget shortfalls. See CSI’s June 2024 report, Iowa’s 2024 Income Tax Cuts, for more.
Departments by Spending Category in this Report
* indicates a department with no direct line-item funding in FY27, whether consolidated under state Alignment or cut outright

State Government Appropriations: Flow of Tax Revenue from the Taxable Source to Categories
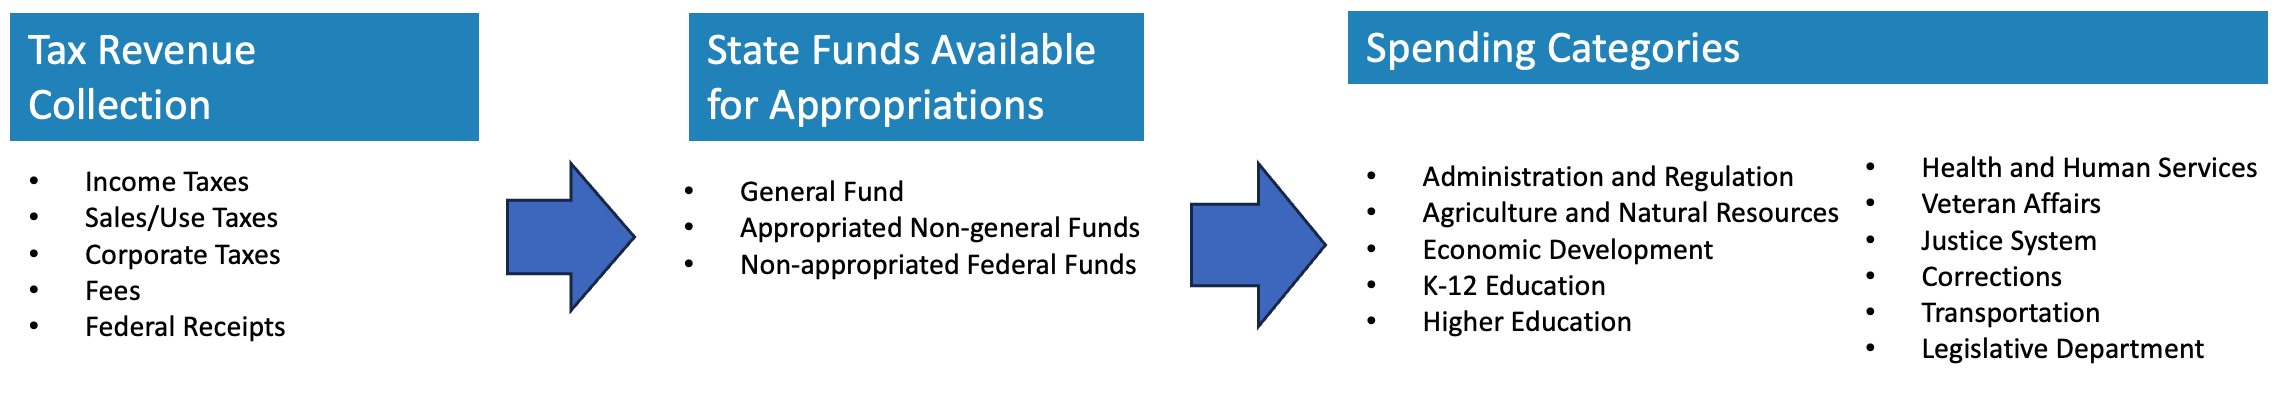
The image above illustrates the flow of state appropriations from tax revenue sources to the state departments the legislature authorizes to spend state revenue. General Fund expenditures are limited to 99% of the adjusted appropriable revenue estimate determined by the Revenue Estimating Conference. That estimate begins with the conference's appropriable General Fund projection for the coming fiscal year, agreed to by December 15, and is then adjusted under state law for new and reduced revenue before the cap applies. The legislature is bound to that December estimate, but if the conference's March meeting projects less revenue, it must budget to the lower March figure. This 99% limit is a ceiling. Appropriations drawn from the adjusted revenue estimate may not exceed it. Reserve-financed spending, however, sits outside it. The Economic Emergency Fund and Cash Reserve Fund are separate from the General Fund, so appropriations from them are not counted against the 99% cap.
How Much Money Does the Iowa State Government Appropriate?

Each year, the state legislature approves and the governor signs a budget that allocates state revenue to government departments. The current budget cycle, fiscal year 2027, runs from July 1, 2026, through June 30, 2027. This year’s general fund budget approximated $9.6 billion. Additional legislative appropriations amount to approximately $1.6 billion. In total, the legislature appropriated about $11.3 billion for FY27.
Iowa Net Revenues and Appropriations FY03 to FY28 (Billions)
Net general fund revenues exceeded appropriations for eight consecutive fiscal years from FY17 through FY24. This allowed the state to build ongoing surpluses and reserve funds. The surpluses have in turn allowed the state to reduce income taxes while continuing to grow state spending each year. After revisions, Iowa’s budget deficit amounted to $26 million for FY25. In FY26, revenues fell by 9.3% to $8.1 billion, causing a deficit of $1.4 billion. In FY27, revenue projections grew 4.4% to $8.4 billion, but the state still recorded a deficit of $1.2 billion. State budgeters aim to fill this deficit gap by tapping into excess surplus funds kept in the Taxpayer Relief Fund (TRF) and other funds. The REC estimates $8.7 billion in revenue in FY28, an increase of 2.9% from FY27. This could amount to a -$1.1 billion deficit assuming an expenditures growth rate similar to FY27.
Iowa Net Revenues, Pre-Pandemic Trend FY03 to FY28 (billions)
Iowa's net general fund revenues grew steadily from FY03 through FY19. Beginning in FY20, revenues began to exceed this trend. By FY22, net revenues reached approximately 9.8 billion, exceeding the pre-pandemic trend by roughly $1.6 billion. Revenues remained well above trend in FY23 and FY24, generating the excess collections that funded reserve buildup and enabled successive rounds of income tax reductions. Net revenues converged back toward the pre-pandemic trend when the 3.8% flat income tax took full effect in FY25, registering a modest $196 million above the trend. Beginning in FY26, revenues fell below the pre-pandemic trend line, with a shortfall of approximately $820 million. This below-trend performance will persist through at least FY27 (- 646 million) and FY28 (-$586 million).
Iowa Net Appropriations, Pre-Pandemic Trend FY03 to FY27 (billions)
Iowa's net appropriations grew steadily from FY03 through FY19, broken only by a temporary dip around FY11 during the recovery from the Great Recession. From FY20 through FY23, appropriations growth tracked closely with the pre-pandemic trend, with annual deviations of less than $110 million in either direction. Beginning in FY25, appropriations began to outpace the pre-pandemic trend, exceeding it by roughly $319 million. The divergence widened further in FY26, when appropriations exceed the pre-pandemic trend by approximately $669 million. The slowdown in spending growth in FY27 brought appropriations down to $614 million above the pre-pandemic trend.
Cash Reserve, Emergency, TRF, and Surplus Funds Since 2020 (millions)
Iowa experienced a $1.7 billion, or 613%, increase in its surplus funds from 2020 to its peak in 2024. The state maintained an ongoing surplus exceeding $1 billion from 2021 through 2026 despite multiple rounds of tax cuts, even reaching over $2 billion in 2024. Nonetheless, FY27 will mark the first fiscal year under a $1 billion surplus carryforward since 2020. According to LSA estimates, the surplus carryforward will decline by $648 million (-42.7%) in 2027 to $870 million. The bulk of the ongoing annual deficit is being absorbed by the surplus carryforward and the Taxpayer Relief Fund (TRF). The TRF balance is down from a peak of $4 billion in 2025 to a projected $2.6 billion by the end of 2027—a $1.5 billion reduction over two years.
General Fund Appropriation by Spending Category: FY26 and FY27 (millions)
From FY25 to FY26, the General Fund's operating total grew by $135 million from $9.5 billion to $9.6 billion, or 1.4%. This is down from a $540 million increase (+6.0%) from FY25 to FY26. In FY27, the five largest budget categories, as identified by CSI, accounted for 93.9% of General Fund appropriations. This share is up from 91.5% in FY00 and 93.8% in FY25, reflecting a continued decline in the proportion allocated to smaller departments.
Change in General Fund Appropriations by Spending Category: FY26 to FY27 (millions)
Education saw the largest nominal year-over-year increase of $122 million, or 2.6%. Its increase exceeded the combined gains of the four other growing categories by more than sixfold. In total, these five departments increased $141 million in appropriations. Administration and Regulation posted the steepest reduction at $2.6 million, its third consecutive annual decline. Four major departments had a decline in appropriations, totaling $5 million.
Which Departments Contributed Most to General Fund Budget Growth in FY27?
The values represent each category’s percent share of the increase in General Fund appropriations from FY25 to FY26 and from FY26 to FY27. A positive value indicates the share increased over this period and a negative value indicates a declining share.
Education saw the large increase in share of general fund appropriations, making up 90.0% of all newly appropriated funds in FY27. In FY26, Education constituted 38.3% of the additional general fund appropriations, while Health & Human Services made up 64.2%. This fiscal year’s budget contributions differ significantly from last year’s due to an increase in baseline spending under Health and Human Services beginning in FY26. The next highest department increase in FY26 was Corrections at 1.4%; it contributed 4.3% of total growth in FY27. Administration and Regulation declined in appropriations for the third year in a row.
Share of General Fund Appropriations to each Spending Category: FY00 - FY27
The top two departments, Education and Health & Human Services, were appropriated 77.8% of the total general fund budget in FY27. This is up from 77.6% in FY26, 72.3% in FY20, 69% in FY10, and 62.4% in FY00. Increased spending on K-12 education and Medicaid have contributed most to the growing Education and Health & Human Services budgets. The next largest combined appropriations for the justice system and corrections amounted to 10.0% in FY27, unchanged from FY26.
Total State Appropriations by Spending Category: FY26 and FY27 (millions)
From FY26 to FY27, the total legislative appropriations grew by $109 million from $11.1 billion to $11.2 billion, or 1.0%. This is up from $647 million (+6.1%) from FY25 to FY26. In FY27, the six largest budget categories, as identified by CSI, accounted for 92.7% of all appropriations. This share is up from 90.5% in FY00 but down from 92.8% in FY26. The reduction of $60 million for Administration & Regulation contributed to this slight decline.
Change in Total Appropriations by Spending Category: FY26 to FY27 (millions)
Education and Health & Human Service saw the largest nominal year-over-year increases of $107.2 and $55.6 million, or 2.2% and 1.7%. Four major departments had a decline in appropriations, totaling $83.5 million. The remaining seven departments had an increase in appropriations, totaling $192.8 million. Economic Development appropriations grew $22.9 million in the last fiscal year, a significant 20.8% increase. Meanwhile, Administration and Regulation declined the most at $59.7 million in the last fiscal year, or a 9.1% reduction. This $59.7 million reduction reflects IPERS spending returning to baseline after a one-time FY26 appropriation from the IPERS Trust Fund for a new pension administration system. IPERS spending rose from $22 million in FY 2025 to $86 million in FY 2026, then settled back to $26 million in FY 2027.
Which Departments Contributed Most to the Total Budget Growth in FY26?
The values represent each category’s percent share of the increase in total fund appropriations from FY25 to FY26 and from FY26 to FY27. A positive value indicates the share increased over this period and a negative value indicates a declining share.
Education and Health & Human Services constituted most of the changes in total fund appropriations, making up a combined 148% of all newly appropriated funds in FY27. In FY26, Education and Health & Human Services combined for 91.6%. The two exceed 100% in FY27 due to significant appropriation reductions across four major categories, of which Administration and Regulation leads with -54% of the total growth. The next highest department in FY26 was the Transportation at 6.5%, which saw a reduction in FY27, resulting in -10.6% of growth. Economic Development increased to 21% in appropriations for FY27, compared to only 2.2% in FY26.
Share of Total State Appropriations to each Spending Category: FY00 - FY27
The top two departments, Education and Health & Human Services, were appropriated 72.2% of the total appropriated budget in FY27. This is up from 71.4% in FY26, 66.6% in FY20, 57.7% in FY10, and 56.1% in FY00. The next single largest department, Higher Education, was appropriated 5.6% for FY27, unchanged from 5.6% in FY26 but less than 14.7% in FY00. Administration and Regulation was appropriated 5.3% for FY27, down from 5.9% in FY26 and 9.5% in FY00. These two budgeting areas have seen the most significant decline in share of appropriations over the last two and a half decades.
Total State Spending per Iowan, Adjusted for Population Growth and Inflation
(in 2027 dollars)
Adjusted for inflation and population growth, total state government appropriations per Iowan increased by 14.5% from FY00 to FY27. General funds per Iowan grew by 9.7% and appropriated non-general funds grew by 55.1%. Since FY26, total adjusted appropriations will fall by 1.0%, general funds by 0.6%, and non-general funds by 3.5%. Population estimates come from the Census Bureau and inflation is derived from the Midwest CPI published by BLS. Inflation for FY27 is estimated at the Federal Reserve’s target rate of 2%. The dotted line represents the average per-capita appropriations for total funds during each government type (trifectas or mixed representation).
Data Sources
Legislative Services Agency, “Judicial Branch Appropriations Bill House File 2769,” Distributed May 3, 2026, https://www.legis.iowa.gov/docs/publications/NOBA/1605155.pdf.
Legislative Services Agency, “Infrastructure Appropriations Bill Senate File 2484,” Distributed May 12, 2026, https://www.legis.iowa.gov/docs/publications/NOBA/1605200.pdf.
Legislative Services Agency, “Economic Development Appropriations Bill House File 2772,” Distributed April 29, 2026, https://www.legis.iowa.gov/docs/publications/NOBA/1604867.pdf.
Legislative Services Agency, “Justice System Appropriations Bill House File 2770,” Distributed May 8, 2026, https://www.legis.iowa.gov/docs/publications/NOBA/1605165.pdf.
Legislative Services Agency, “Administration and Regulation Appropriations Bill House File 2768,” Distributed April 30, 2026, https://www.legis.iowa.gov/docs/publications/NOBA/1604857.pdf.
Legislative Services Agency, “Agriculture and Natural Resources Appropriations Bill, House File 2771,” Distributed June 2, 2026, https://www.legis.iowa.gov/docs/publications/NOBA/1605545.pdf.
Legislative Services Agency, “Education Appropriations Bill House File 2783,” Appropriation Bill Analysis, Distributed May 2, 2026, https://www.legis.iowa.gov/docs/publications/NOBA/1605130.pdf.
Legislative Services Agency, “Health and Human Services Appropriations Bill House File 2782,” Appropriation Bill Analysis, Distributed May 12, 2026, https://www.legis.iowa.gov/docs/publications/NOBA/1605124.pdf.
Legislative Services Agency, “Standing Appropriations Bill, House Fil 2800,” Appropriation Bill Analysis, Distributed May 19, 2026, https://www.legis.iowa.gov/docs/publications/NOBA/1605279.pdf.
Legislative Services Agency, “Transportation Appropriations Bill Senate File 2478,” Distributed May 13, 2026, https://www.legis.iowa.gov/docs/publications/NOBA/1605159.pdf.
Legislative Services Agency, “State of Iowa, Projected Condition of the General Fund,” Distributed May 3, 2026, https://www.legis.iowa.gov/docs/publications/EOS/1604751.pdf.
Legislative Services Agency, “End of Session Information,” https://www.legis.iowa.gov/publications/fiscal/endofsession.
Department of Management, “REC Projections,” https://dom.iowa.gov/boards-committees/revenue-estimating-conference/rec-projections.
Department of Management, “State Budget,” https://dom.iowa.gov/state-government/state-budget.
Iowa Department of Management, “State Budget overview,” State of Iowa, Accessed June 24, 2026; https://dom.iowa.gov/state-government/state-budget.
Iowa Code § 8.54, “General Fund Expenditure Limitation,” State of Iowa, Accessed June 24, 2026, https://www.legis.iowa.gov/docs/code/8.54.pdf.
Iowa Code § 8.22A(3), “Revenue Estimating Conference,” State of Iowa, Accessed June 24, 2026, https://law.justia.com/codes/iowa/title-i/chapter-8/section-8-22a/.