






July 9, 2026

Introduction
Despite recent declines in motor vehicle theft in Colorado, the state has consistently ranked among the states with the highest motor vehicle theft rates per 1,000 registered vehicles nationwide. Colorado ranked 1st nationally in motor vehicle theft rates from 2020 through 2022, and 2nd in both 2023 and 2024.[1]
The impacts of Colorado’s motor vehicle theft problem extend beyond crime statistics. While thefts have declined markedly since reaching record highs in 2022, Colorado remains one of the nation’s leaders in vehicle theft rates. This report examines theft trends across the state, compares Colorado to national benchmarks and other crime categories, and analyzes Denver and Aurora’s recent progress.
The report also finds that Colorado’s nation-leading theft rate imposes a measurable economic burden, increasing auto insurance costs by an estimated $201 million per year, or roughly $84 per household, on top of the financial losses experienced by theft victims.
Key Findings
Colorado placed at or near the top for motor vehicle theft rate per 1,000 registered vehicles between 2020 and 2024
- Colorado had the nation’s worst auto theft rate between 2020 and 2022. The state placed 2nd in 2023 and 2024, behind New Mexico both years.
Colorado’s high motor vehicle theft rate costs Colorado families hundreds of millions each year through higher insurance premiums
- CSI analysis estimates that Colorado households pay an estimated $201 million more in combined vehicle insurance premiums each year because of the state’s high motor vehicle theft rate.[2]
- The state’s elevated vehicle theft rate translates to roughly $84 in additional annual vehicle insurance costs per household.
Localized areas in Colorado have observed declines in auto theft
- In Aurora, motor vehicle thefts fell from 6,801 in 2022 to 2,059 in 2025, a decline of nearly 70%.
- After auto thefts peaked in Denver during the first quarter of 2022, motor vehicle thefts declined by about 73% through the second quarter of 2026.
Recent declines in the number of motor vehicle thefts have not been enough to improve Colorado’s rank relative to other states
- Motor vehicle thefts in Colorado have fallen by nearly 60% since peaking in 2022, yet the state remains one of the nation’s leaders in vehicle thefts.
- Between 2022 and 2024, motor vehicle theft exceeded every other major crime category in Colorado.
Nationwide Motor Vehicle Theft Rates
Using motor vehicle theft data from the Federal Bureau of Investigation and vehicle registration data from the U.S. Department of Transportation Federal Highway Administration, motor vehicle theft rates were calculated as the number of stolen vehicles per 1,000 registered vehicles in each state.
Between 2020 and 2022, Colorado ranked 1st nationally in motor vehicle theft rate per 1,000 registered vehicles. Although the state’s ranking improved in subsequent years, Colorado still placed 2nd nationally in 2023 and 2024, indicating that motor vehicle theft remains a significant public safety and economic concern. Figure 1 shows state rankings based on auto theft rates per 1,000 registered vehicles in 2024.
Figure 1: Motor Vehicle Theft Rates by State per 1,000 Registered Vehicles (2024)
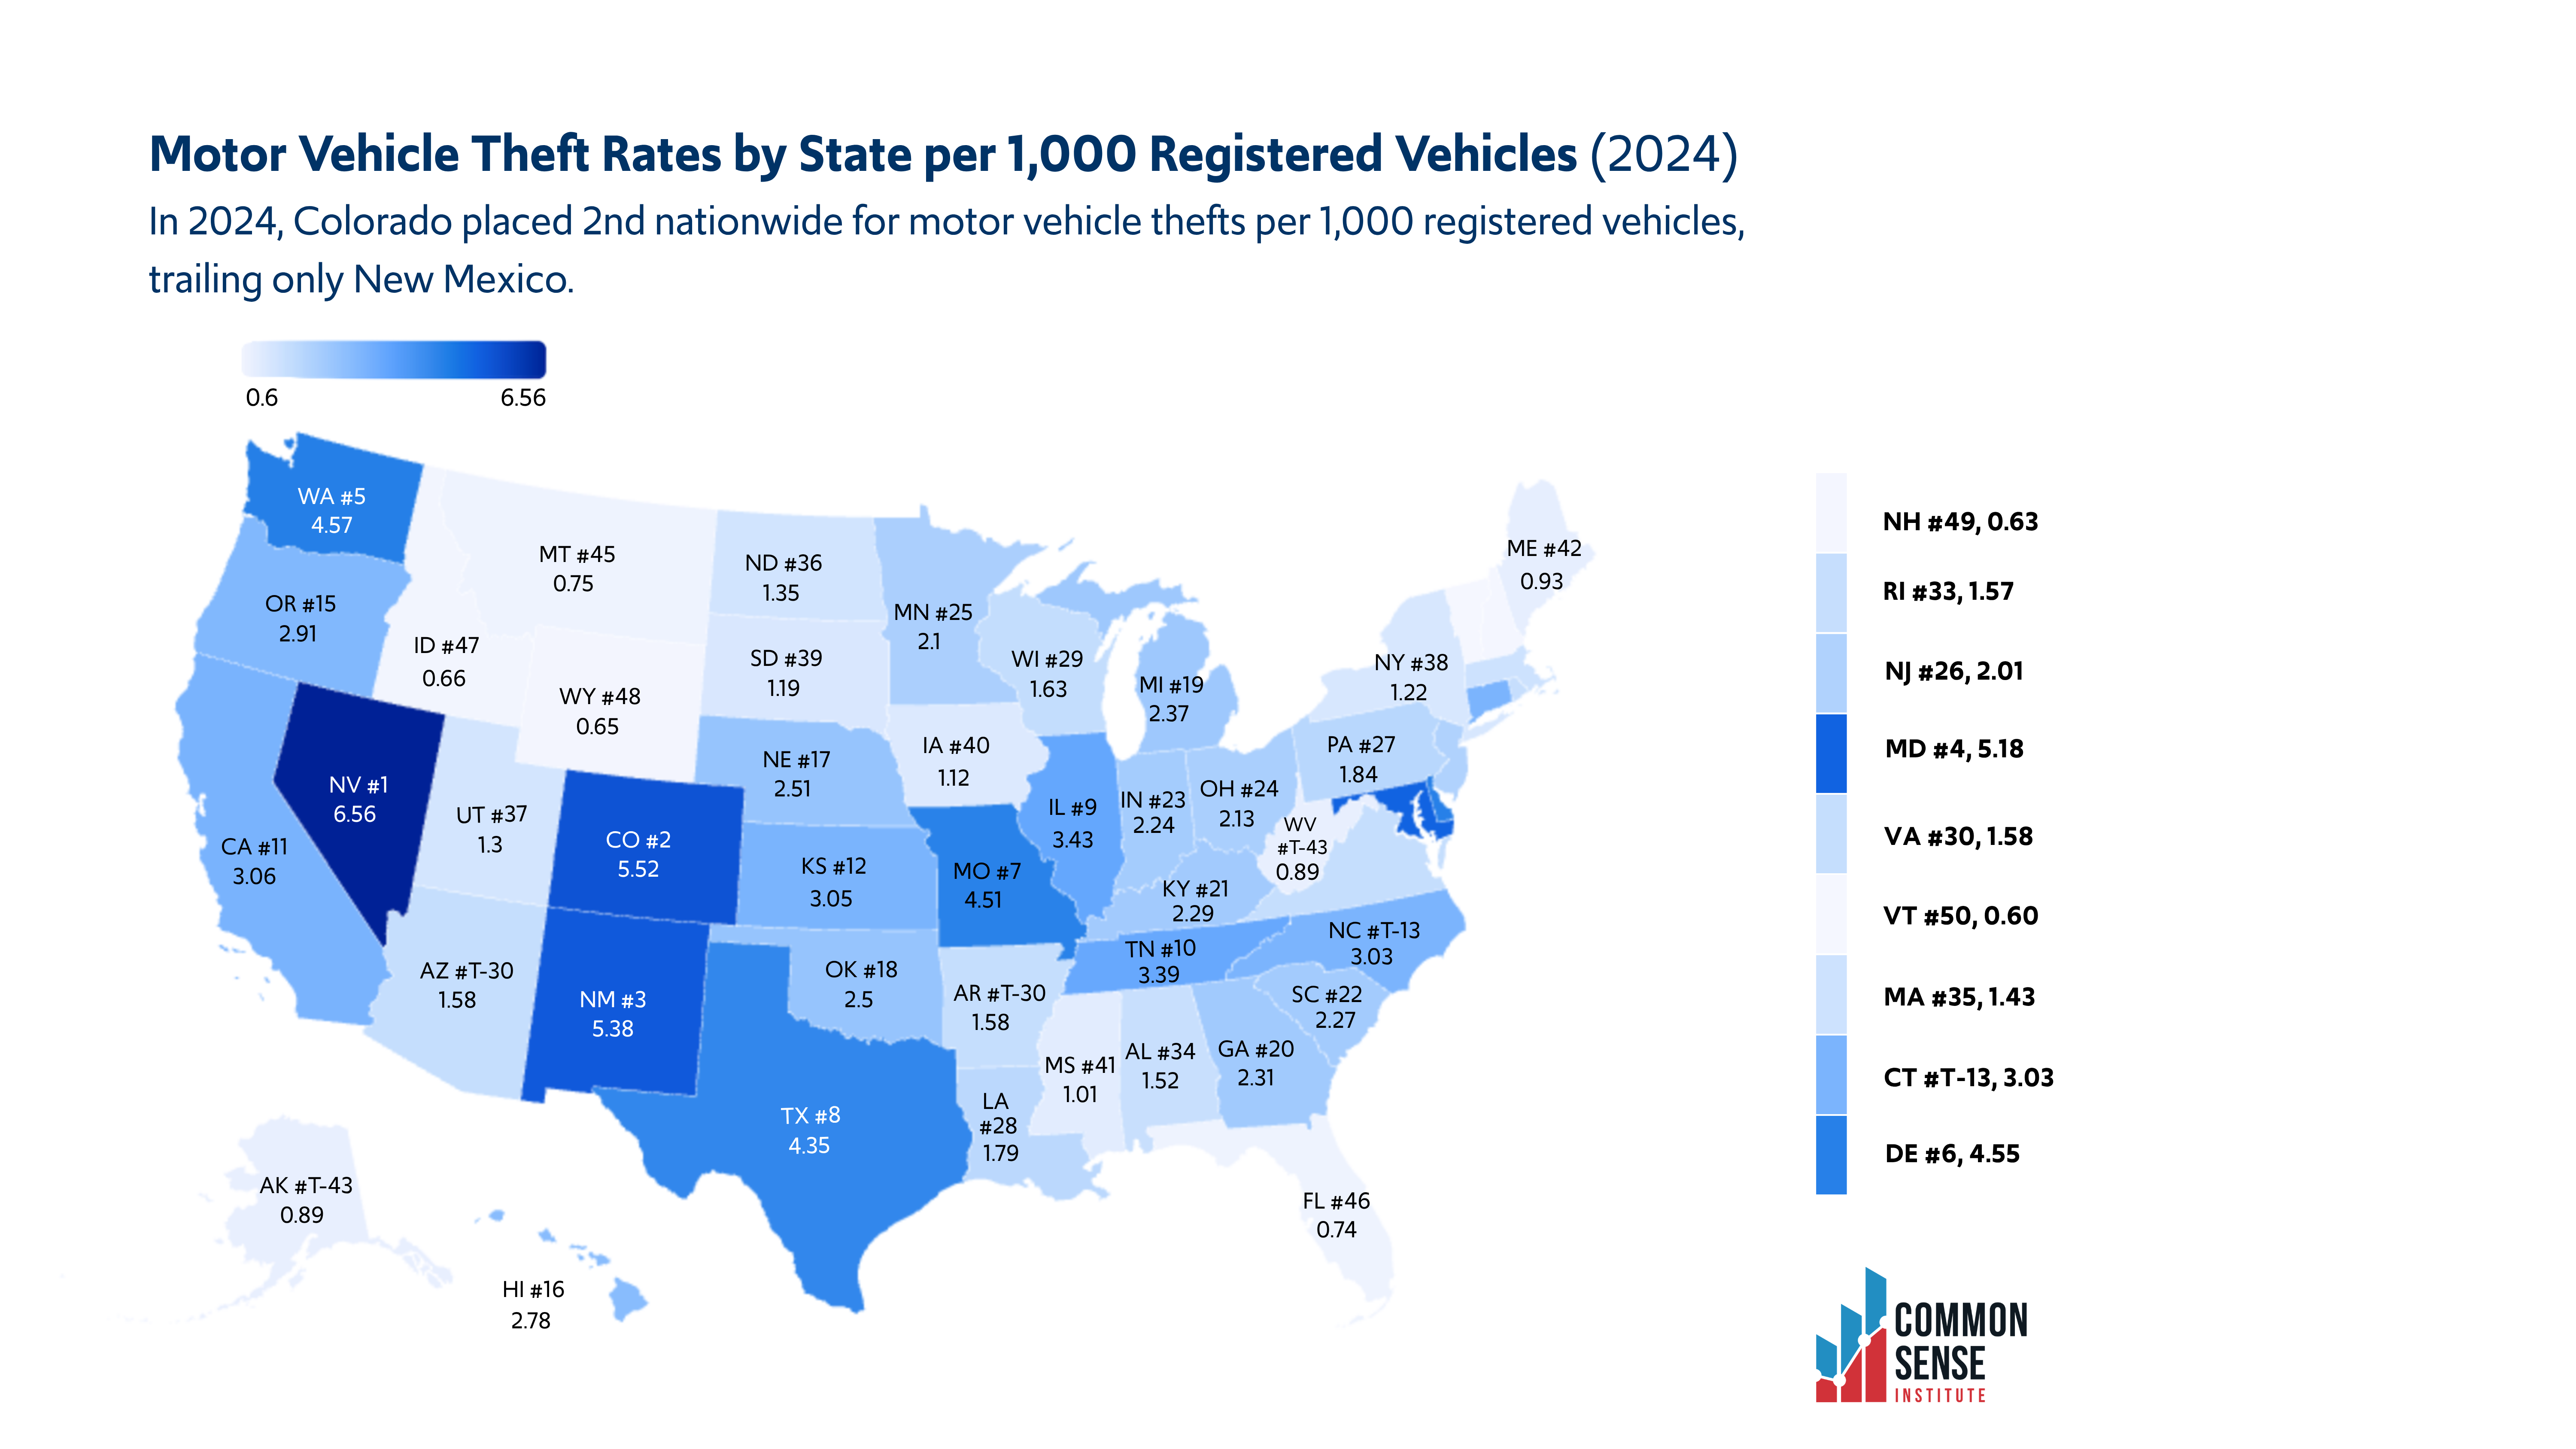
Table 1 shows the comparison between the national average and Colorado’s motor vehicle theft rates per 1,000 registered vehicles.
Table 1: Colorado and U.S. Average Motor Vehicle Theft Rates Per 1,000 Registered Vehicles
|
|
2020 |
2021 |
2022 |
2023 |
2024 |
|
Colorado Auto Theft Rate per 1,000 Registered Vehicles |
5.64 |
8.02 |
8.91 |
7.26 |
5.52 |
|
National Average Auto Theft Rate per 1,000 Registered Vehicles |
1.79 |
2.16 |
2.46 |
2.79 |
2.32 |
At its peak in 2022, Colorado’s theft rate was more than 3.6 times the national average, underscoring the impact of vehicle theft on Colorado residents and businesses.
Colorado’s Motor Vehicle Thefts
Since 2008, the first year of available CBI data, motor vehicle thefts in Colorado increased by about 63% through 2025. However, that long-term increase was largely driven by an unprecedented surge during the pandemic years. Figure 2 shows the trend of motor vehicle thefts in Colorado over time.
Figure 2: Motor Vehicle Thefts in Colorado (2008-2025)
Since reaching a record high of 47,248 thefts in 2022, annual motor vehicle thefts have fallen by approximately 59% through 2025. However, Colorado still recorded more than 19,000 motor vehicle thefts in 2025, roughly 7,500 more thefts than in 2008, indicating that vehicle theft remains substantially above both pre-pandemic levels and those observed in the early 2000s.
Motor Vehicle Thefts and Other Crimes
Among major offenses, motor vehicle thefts experienced the largest increase (+110%) between 2019 and 2022 and the steepest decline thereafter (-59%). These offenses include fraud, aggravated assault, burglary, non-consensual sex offenses, robbery, and murder. Figure 3 shows the trends among these offenses compared to motor vehicle thefts in the state since 2008.
Figure 3: Motor Vehicle Thefts Compared to Other Crimes
No other major offense experienced such rapid growth and such a substantial decline over the same period. Despite this improvement, theft levels remain elevated compared to pre-pandemic trends.
Denver Snapshot
While Colorado has consistently ranked among the states with the highest motor vehicle theft rates, Denver’s recent trend has been markedly different. After auto thefts peaked in the first quarter of 2022, motor vehicle thefts declined by about 73% through the second quarter of 2026. The sustained decline suggests that the unprecedented spike in vehicle thefts during the pandemic has largely subsided in the city. Figure 4 demonstrates the quarterly changes in motor vehicle thefts in Denver since 2021.
Figure 4: Denver Auto Thefts by Quarter (2021-2026)
Nearly every quarter since Q1 2022 has recorded fewer thefts than the corresponding quarter in the previous year.
Between Q1 and Q2 of 2025, Denver recorded 2,930 motor vehicle thefts, compared to 2,192 during the same period in 2026. This represents a decrease of 738 thefts, or approximately 25%, year over year.
SB23-097: Motor Vehicle Theft and Unauthorized Use
Taking effect on July 1, 2023, SB23-097 eliminated Colorado’s value-based penalty system for motor vehicle theft. Before this law was enacted, the severity of the charge depended on the dollar-value of the stolen vehicle. Now, however, motor vehicle theft is a felony depending on factors such as an individual’s prior convictions and how they used the stolen vehicle. The law established the following classifications:
- First-degree motor vehicle theft: Class 3 felony
- Second-degree motor vehicle theft: Class 4 felony
- Third-degree motor vehicle theft: Class 5 felony
- Unauthorized use of a motor vehicle: Class 1 misdemeanor (first offense); Class 5 felony (second or subsequent offense)
Denver’s downward trend in auto thefts continued after SB23-097 took effect in July 2023. Although the timing suggests the law may have been one of several factors influencing theft trends, the available data do not establish a direct causal relationship between the legislation and the subsequent decline in vehicle thefts.
Aurora Snapshot
In addition to SB23-097 at the state level, some local governments have adopted their own policies aimed at deterring vehicle theft.
The City of Aurora implemented mandatory minimum sentencing guidelines for auto theft in 2022, the year that both Colorado and Aurora’s auto theft rates were the highest. This ordinance took effect in August 2022 and was renewed in 2024 after its initial two-year term expired.
According to the Aurora Police Department, motor vehicle thefts fell from 6,801 in 2022 to 2,059 in 2025, a decline of nearly 70%. Furthermore, APD data show that as of June 28, 2026, Aurora has experienced 690 auto thefts compared to 1,123 auto thefts during the same period last year – a decrease of approximately 38.6% in between the two years.[i]
Auto Insurance Costs
In 2025, Governor Polis released a “Roadmap to Reduce Auto Insurance Premiums” to address the high costs of vehicle insurance premiums in the state.[ii] According to NAIC’s auto insurance database, Colorado ranked 6th in the nation for the largest increase in auto insurance costs between 2019 and 2023.
Differences in average auto insurance premiums across the country are driven by many factors, including vehicle theft rates, weather, traffic density, the demographic makeup of drivers, and auto laws. According to the National Association of Insurance Commissioners (NAIC), vehicle theft rates play an important role in determining the cost of comprehensive auto insurance coverage, but how much do they matter?
This report analyzes NAIC’s combined average premiums which sum the average costs for the following three coverages: liability, comprehensive, and collision. The cost for each state is per insured vehicle for one year.
To estimate the financial impact of Colorado’s elevated vehicle theft rate on households, CSI performed a fixed effects panel regression from 2020 through 2024 where a state’s typical car insurance rate is a function of the number of auto thefts per 1,000 vehicles and the cost of living. Although the model has limitations, the results provide useful insight into the relationship between vehicle theft and insurance premiums. Consistent with both the regression results and the scatterplot shown below, states with higher vehicle theft rates generally experience higher car insurance premiums.
Using the panel regression results in the Appendix, Colorado households pay an estimated $201 million more in annual car insurance premiums because of the state’s nation-leading car theft rate. This equates to approximately $84 per household annually.
Figure 5: Car Thefts per 1,000 Registered Vehicles and Combined Average Car Insurance Premium
Since Colorado has the highest or next to highest vehicle theft rate in the nation, it also stands to benefit the most from reducing theft. As of now, Colorado is in the top right quadrant – high car insurance premiums and a high car theft rate – a place no state wants to be. States such as New Hampshire, Idaho, and Maine occupy the most desirable position on the chart, combining low vehicle theft rates with relatively low insurance premiums.
Hidden Costs of Stolen Vehicles
Vehicle theft creates financial burdens that extend well beyond the initial loss of a vehicle. When a stolen vehicle is recovered, owners may face towing and impound expenses that vary by jurisdiction. For example, Denver waives all towing and storage fees for recovered stolen vehicles, while Aurora only waives these fees if the vehicle is retrieved within 72 hours, and Arvada may require people to pay towing and storage costs, although some insurance policies reimburse these expenses. [iii][iv][v]
Beyond impound fees, many recovered vehicles require repairs for broken windows, ignition damage, vandalism, or stolen parts. Even when insurance covers these damages, vehicle owners are typically responsible for paying a comprehensive insurance deductible, which typically ranges from $100 to $1,000, with $500 being among the most common amounts. The economic impact of vehicle theft includes indirect losses such as missed work, lost wages, reduced productivity, and increased transportation expenses. Together, these direct and indirect costs demonstrate that vehicle theft creates a financial burden even when insurance coverage is available.
Bottom Line
Although motor vehicle thefts in Colorado have declined, the state continues to rank among the highest in the nation for motor vehicle theft. Colorado households spend an estimated $201 million more on car insurance premiums each year, about $84 per household, because of the state’s elevated motor vehicle theft rate on top of out-of-pocket costs incurred by victims.
Appendix
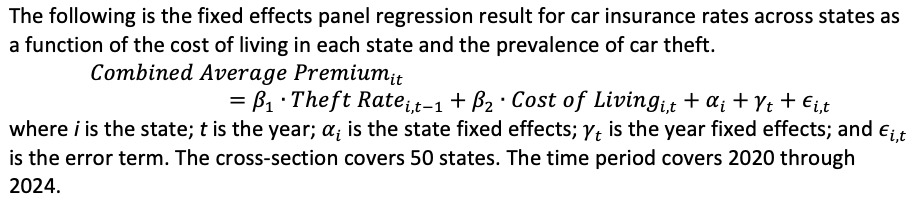
Regression Table
Table 1. Fixed-effects regression of insurance premiums on auto theft
|
|
Combined Average Premium |
|
Car theft rate, lagged one year |
11.14* |
|
|
(4.365) |
|
Cost of Living Index |
-1.160 |
|
|
(1.899) |
|
State fixed effects |
Yes |
|
Year fixed effects |
Yes |
|
Clustered standard errors |
state_id |
|
Observations |
196 |
|
R2 |
0.98494 |
|
Within R2 |
0.05415 |
Notes: Standard errors clustered by unit_id are shown in parentheses. The model includes state and year fixed effects.
* p < 0.05, ** p < 0.01, *** p < 0.001.
[i] Aurora Police Department Transparency Portal
RECENT/RELATED RESEARCH
Proposition 132: Increasing Opioid Penalties

Introduction When Colorado voters take to the polls this November, one of the measures they will see is Proposition 132,…
Colorado Labor Market Update – July 2026
Colorado Labor Market Update – July 2026 Summary Colorado experienced moderate employment growth over the last month. After adding 1,900…
Initiative 177: Right to Natural Gas

Initiative 177: Right to Natural Gas Introduction Colorado voters will consider several ballot initiatives in November 2026, including Initiative 177,…
Ballot Initiative 108: Penalties for Human Trafficking of Minors

Ballot Initiative 108: Penalties for Human Trafficking of Minors Introduction Voters this November will decide whether to approve Initiative 108,…