Administrative Growth, Student Decline, and Academic Performance in Colorado’s Public Schools
Introduction
Colorado's public-school system has continued to add administrative positions even as statewide student enrollment has declined. Between the 2021–22 and 2025–26 school years, the number of administrators increased from 2,014 to 2,277, a 13.1% increase, while the number of students declined from 886,517 to 870,793, a 1.8% decrease.
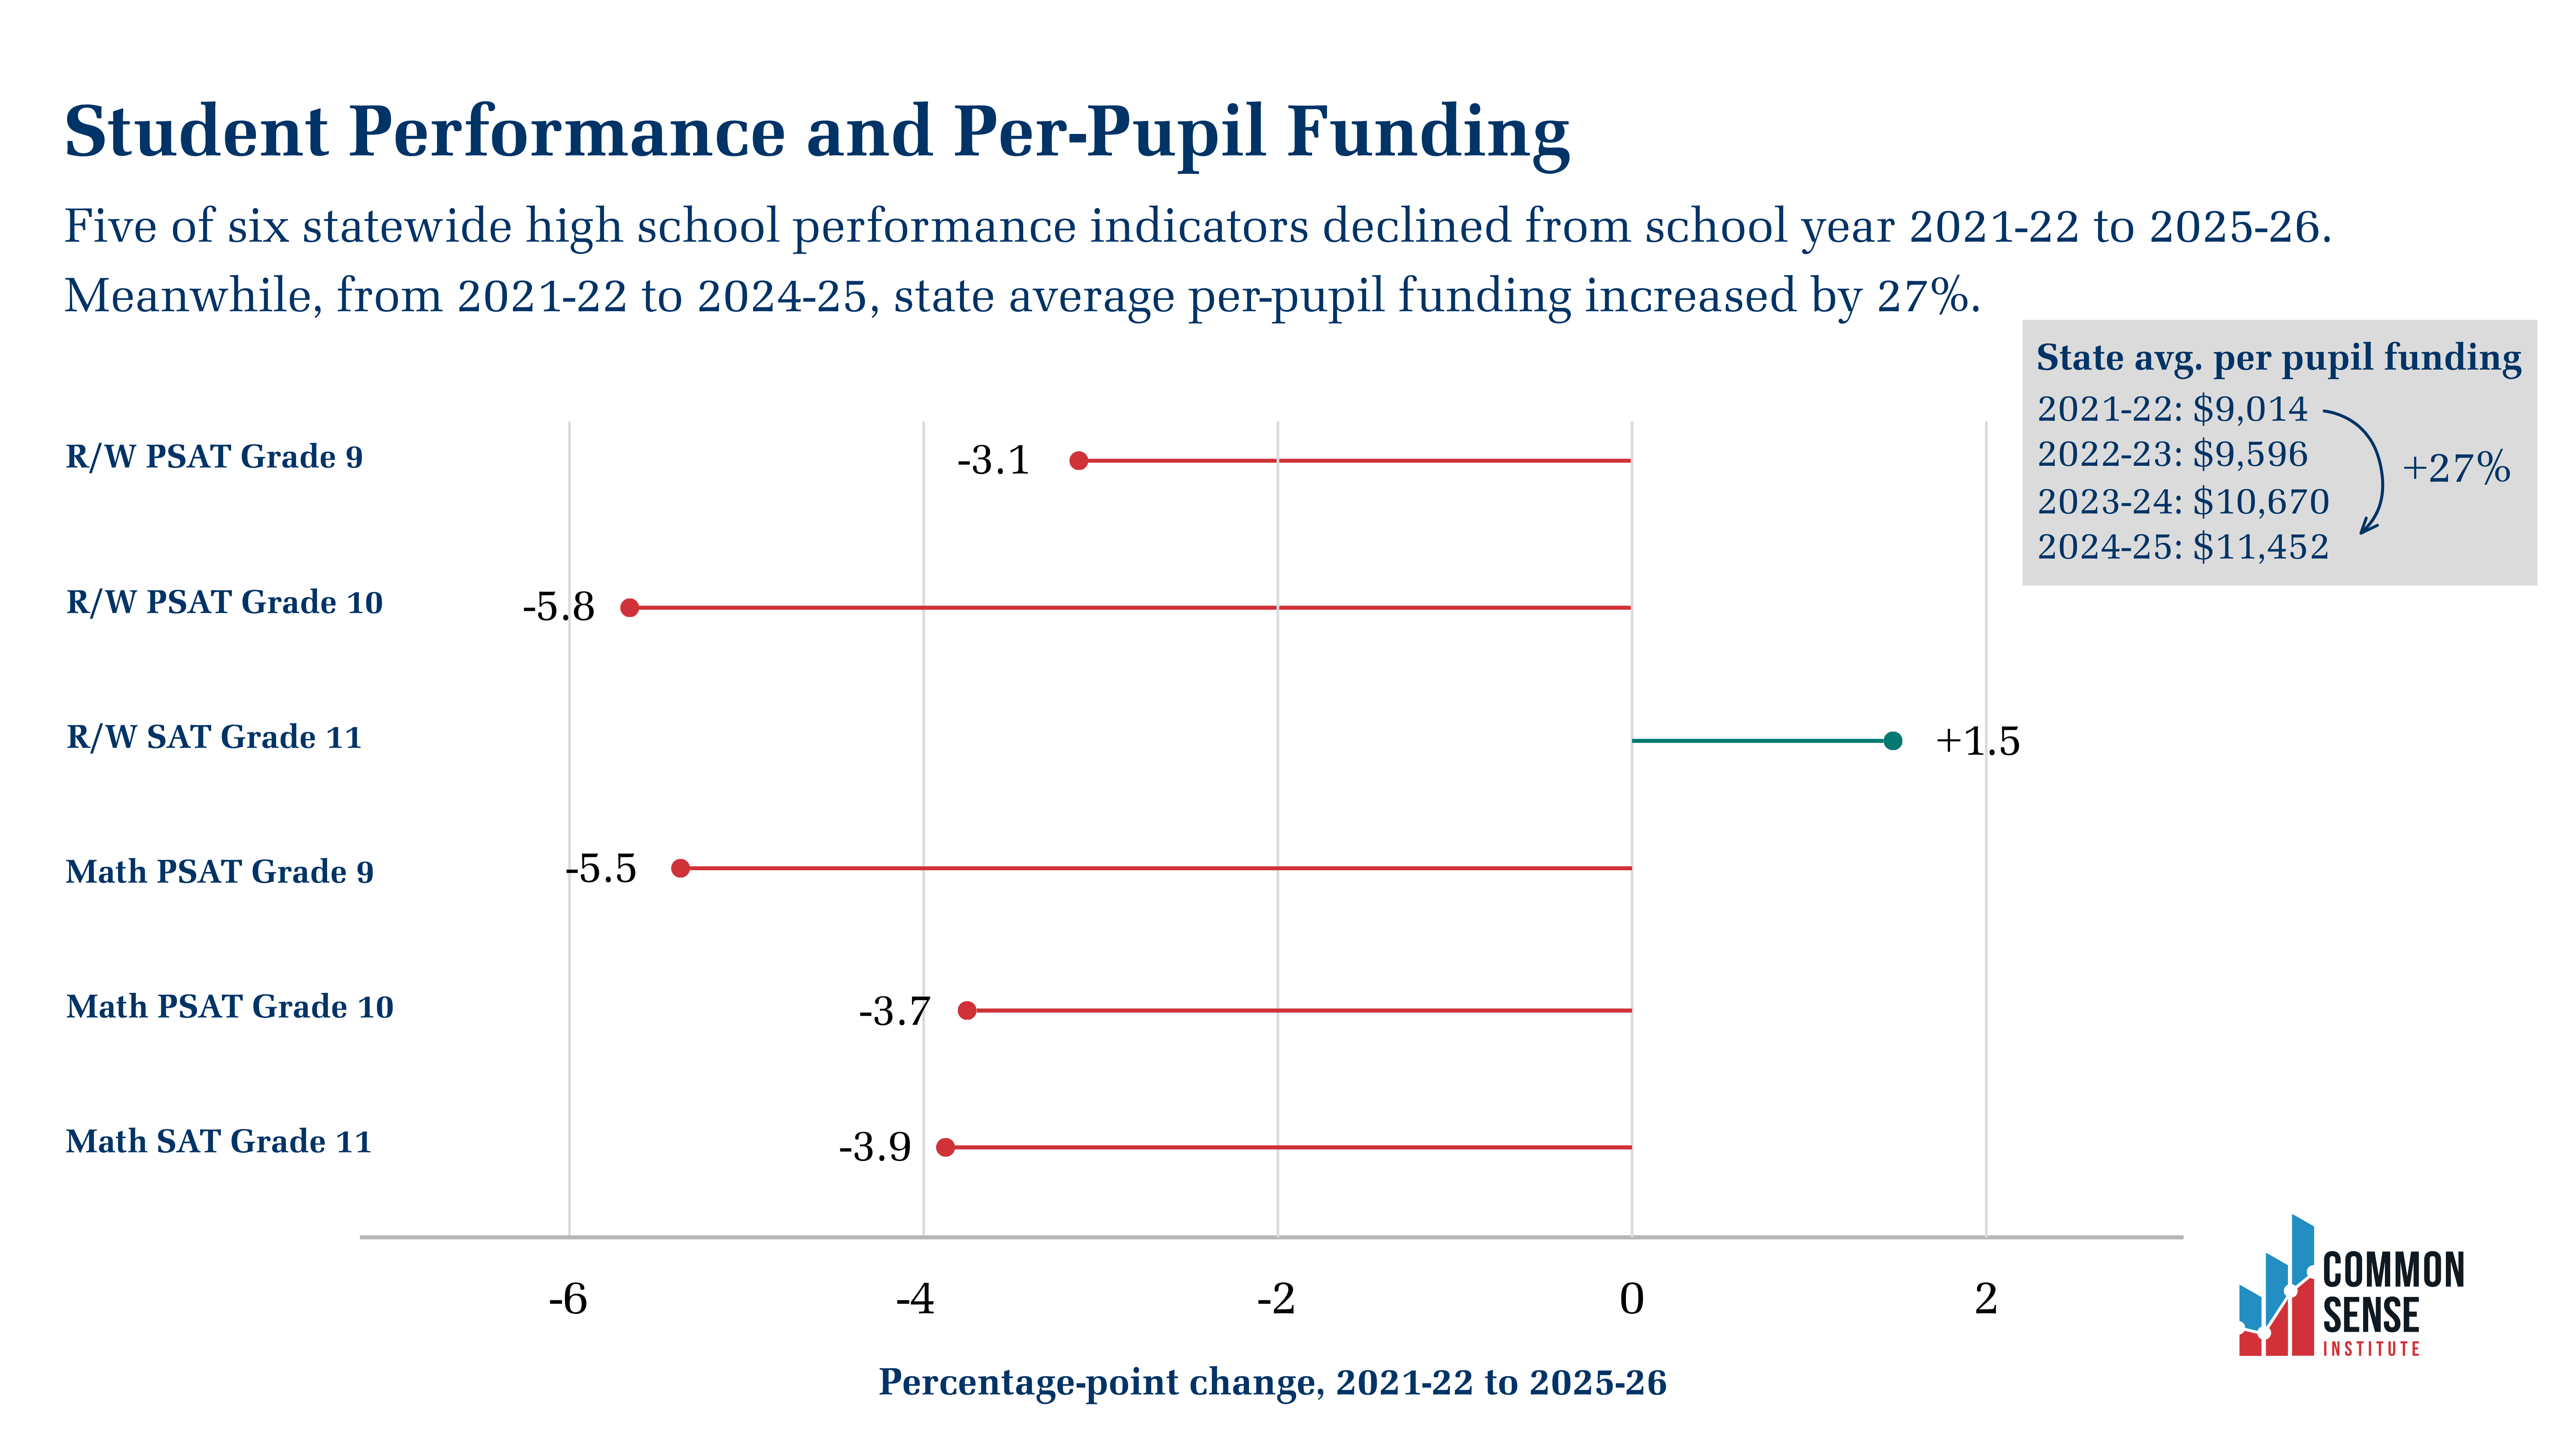
During roughly the same period, average per-pupil funding rose substantially. Between 2021–22 and 2024–25, state average per-pupil funding increased from $9,014 to $11,452, a 27% increase.
Yet student performance has not improved commensurately.
From 2021 to 2025, five of six statewide PSAT/SAT reading, writing, and math indicators declined, with only 11th-grade reading and writing improving.
At a time when Colorado faces growing budgetary pressure and education remains one of the state’s highest funding priorities, the continued expansion of administrative staffing raises important questions about resource allocation. With fewer students enrolled and academic performance declining across most high-school tested categories, districts should be expected to demonstrate whether added administrative capacity is improving student outcomes or diverting resources from more impactful classroom needs.
Key Findings
Administrative positions grew while student enrollment and teacher counts declined
- From 2021–22 to 2025–26, the number of Colorado public-school administrators increased 13.1%, while the number of students declined 1.8%.
- Colorado added 263 administrators while serving 15,724 fewer students.
- Over the same period, the number of teachers in Colorado declined by 1.3%, or 744.
Per-pupil funding increased sharply yet student performance has continued to decline
- Average per-pupil funding rose 27% from 2021–22 to 2024–25, the latest year in the available data.
- Yet from 2021 to 2025, statewide PSAT/SAT performance (covering grades 9–11) declined in five of six reading, writing, and math categories.
- The only measured improvement was in 11th-grade reading and writing.
Colorado’s students show especially weak performance in math
- In 2025, only 37.5% of 9th-grade students, 36.4% of 10th-grade students, and 32.5%, less than a third, of 11th-grade students met or exceeded math expectations.
Administrative growth has continued despite declining enrollment and teacher count
Between the 2021–22 and 2025–26 school years, Colorado’s public schools added administrative positions even as student enrollment declined. The number of administrators grew from 2,014 to 2,277, while statewide student enrollment fell from 886,517 to 870,793.
Colorado’s teacher count, however, appears to be more correlated with student enrollment. While the state’s total student count fell by 1.8%, Colorado also lost 744 teachers, a 1.3% drop.
The divergence raises an important concern: whether administrative staffing growth in Colorado’s K–12 system responds to changes in enrollment and student performance in the same way teacher staffing appears to, or whether it has become increasingly detached from the number of students the system serves and the academic outcomes it produces.
|
Position Category
|
2021–2022 Headcount
|
2022–2023 Headcount
|
2023–2024 Headcount
|
2024–2025 Headcount
|
2025–2026 Headcount
|
2022–2026% Change
|
|
Administrators
|
2,014
|
2,077
|
2,170
|
2,258
|
2,277
|
13.06%
|
|
Students
|
886,517
|
882,933
|
881,464
|
881,065
|
870,793
|
-1.77%
|
|
Teachers
|
55,511
|
55,197
|
55,358
|
55,040
|
54,767
|
-1.3%
|
Additionally, administrative growth should not be viewed as a mundane staffing shift because administrators are relatively high-cost employees. Even modest growth in the category can absorb tens of millions of dollars.
Student performance declined in nearly every high-school testing category despite large funding increases
As Colorado’s K–12 education system served fewer students and total education funding increased, the state’s average per-pupil funding grew dramatically from school year 2021–22 to 2024–25, increasing by 27%.
The state average per-pupil funding growth referenced throughout this report represents only state funds and does not reflect total per-pupil funding. Because both local and federal funds also support students’ education, total per-pupil funding is higher than the figures presented here. State average per-pupil funding was used in this report rather than total per-pupil funding because local and federal funding data are not yet available for school year 2024–25. The growth of state funding per pupil closely resembles that of total per-pupil funding. From school year 2021–22 to 2023–24, total funding per pupil grew by 16.7% while state average per-pupil funding grew 18.4%.
Neither this funding increase nor administrative staff growth has led to broad academic improvement. From school year 2021–22 to 2025–26, statewide PSAT/SAT performance (measuring grades 9–11) declined in five of six reading, writing, and math categories.
 The contrast between rising funding and declining performance should help inform future education policy debates. While average per-pupil funding increased dramatically, student performance declined in nearly every measured high-school reading, writing, and math category.
This doesn’t mean funding is completely decoupled from student success, but it does suggest that additional spending alone does not automatically produce stronger academic outcomes. Going forward, education funding discussions should focus not only on how much money is spent, but whether those dollars are reaching the classroom and improving student achievement.
Math proficiency remains especially weak
One area of particular concern for student performance is math proficiency. Math proficiency remains lower than reading and writing across all tested high school grades by a significant margin. In the 2025–26 school year, only 37.5% of 9th-grade students, 36.4% of 10th-grade students, and 32.5% of 11th-grade students met or exceeded math proficiency expectations.
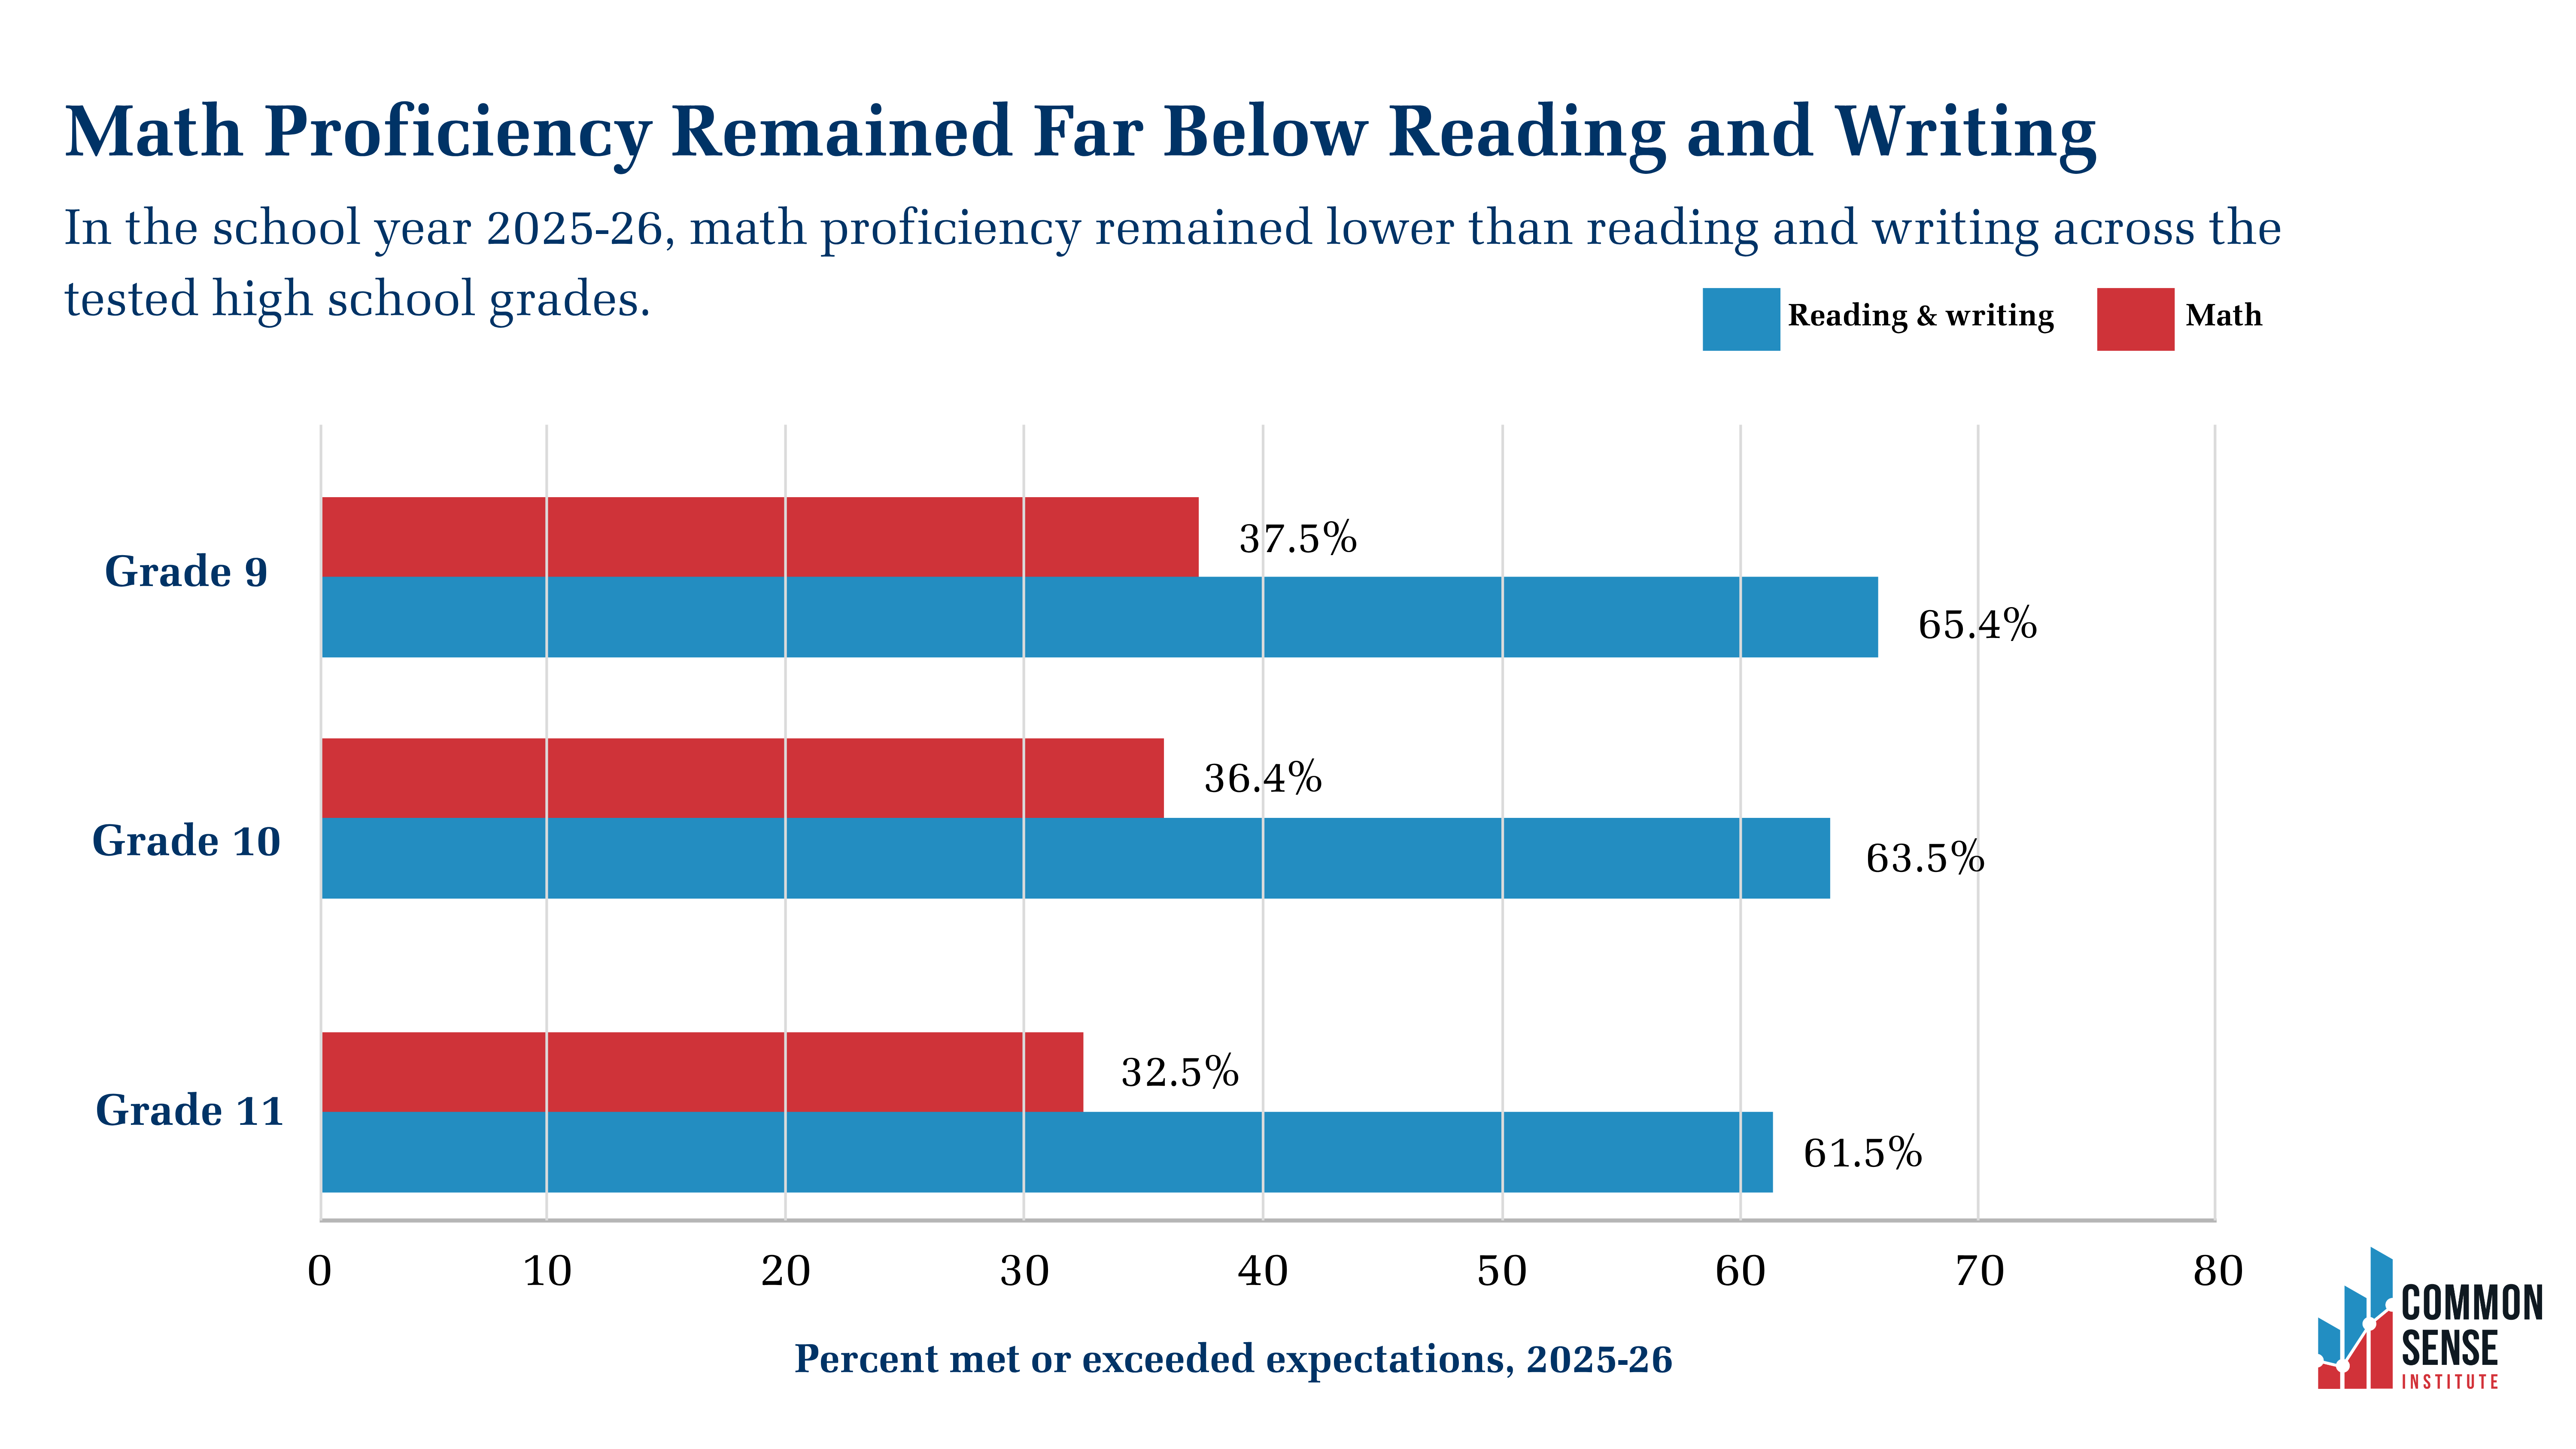
Notably, the share of students who are proficient in reading/writing and math declines in each successive grade, meaning a progressively smaller percentage of Colorado students are meeting proficiency requirements as they progress through the state’s education system. While it is unclear to what degree it impacts academic performance, it is worth noting that the students represented in the figure above had their formative educational years disrupted by COVID-19.
Bottom Line
Since COVID-era disruptions subsided, Colorado's public-school system has continually added administrative positions while serving fewer students.
At the same time, average per-pupil funding increased substantially thanks to fewer students being served and continued growth of total education funding, yet student performance declined in nearly every statewide PSAT/SAT reading, writing, and math category from 2021 to 2025. These trends suggest that additional funding and administrative growth have not translated into broad academic improvement.
Colorado’s education system should be expected to show that new spending and staffing decisions are connected to student needs. If administrative staffing continues to grow while enrollment falls and performance remains weak, policymakers and districts should more clearly explain how those choices support academic recovery and long-term student success.